Unlock a world of possibilities! Login now and discover the exclusive benefits awaiting you.
- Qlik Community
- :
- All Forums
- :
- QlikView App Dev
- :
- Creating Dynamic TOP# Bar Charts with Variables
- Subscribe to RSS Feed
- Mark Topic as New
- Mark Topic as Read
- Float this Topic for Current User
- Bookmark
- Subscribe
- Mute
- Printer Friendly Page
- Mark as New
- Bookmark
- Subscribe
- Mute
- Subscribe to RSS Feed
- Permalink
- Report Inappropriate Content
Creating Dynamic TOP# Bar Charts with Variables
Greetings!
I'm trying to use a input variable to control how many customers will be analyzed in a ranking bar chart.
I tried using the variable here:
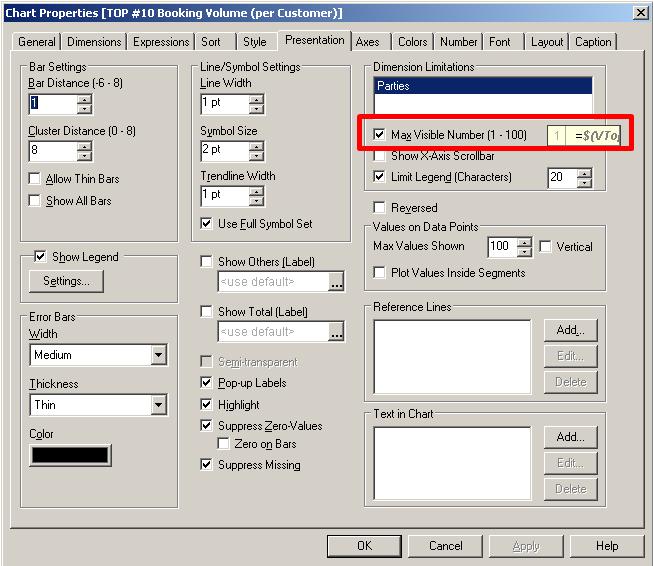
But no data is displayed on the chart, implying that it does not work.
Anyone have ever stepped upon it before?
Thank you very much in advance guys! Live long and prosper! \\ //_
Accepted Solutions
- Mark as New
- Bookmark
- Subscribe
- Mute
- Subscribe to RSS Feed
- Permalink
- Report Inappropriate Content
Hi,
I have used this technique in the past. I have created two sliders which works with one variable, I mean one slider contains % of rows to display and other one Count of rows to display. And also used Top & Bottom toggle button to show the top or bottom %/Count of rows. To get this working I have used sorting by expression.
I don’t see any problem with your variable. It also shows that you have included equal to(“=”) at the beginning of the variable. Have you tried to check the variable value in TextBox to see if it changes? It will be good if you can post the QV document... I can look into this issue for you.
Cheers - DV