Unlock a world of possibilities! Login now and discover the exclusive benefits awaiting you.
- Qlik Community
- :
- All Forums
- :
- QlikView App Dev
- :
- Calculated Dimension Problem
- Subscribe to RSS Feed
- Mark Topic as New
- Mark Topic as Read
- Float this Topic for Current User
- Bookmark
- Subscribe
- Mute
- Printer Friendly Page
- Mark as New
- Bookmark
- Subscribe
- Mute
- Subscribe to RSS Feed
- Permalink
- Report Inappropriate Content
Calculated Dimension Problem
Hello to all,
I am currently working on a ABC-Analysis for our product base.
I want to build this into our Qlikview dashboard using a grid chart.
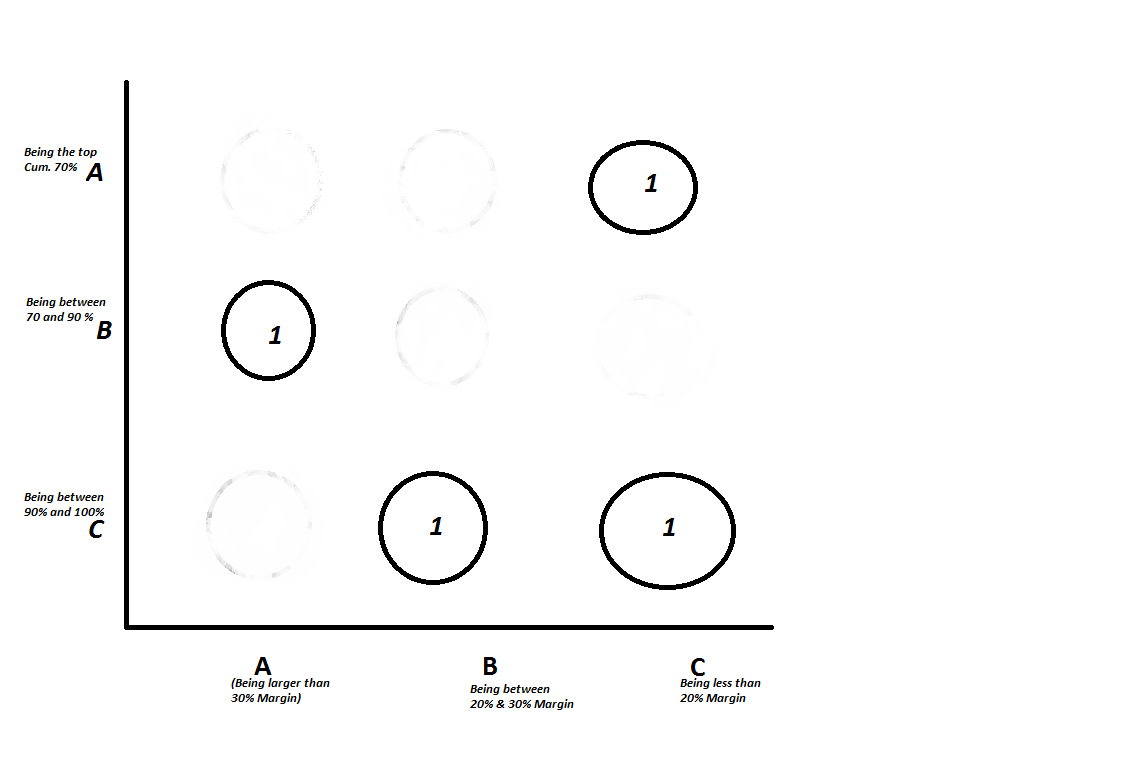
Our ABC-Analysis is based on Sales and on Margin as follows:
Sales: top 70% = A, between 70% and 90% = B, between 90% and 100% = C.
Short example to clarify:
| Product | Sales | % of Total | Cum. % | ABC |
|---|---|---|---|---|
| CCC | 25.000 | 60% | 60% | A |
| AAA | 10.000 | 24% | 84% | B |
| BBB | 6.500 | 15% | 99% | C |
| DDD | 500 | 1% | 100% | C |
| TOTAL | 42.000 | 100% |
As you can see, as soon as the Cum. % is higher than 70%, it becomes B, and as soon as it is higher than 90%, it becomes a C.
Margin: if the Margin is larger than 30% = A, if between 20% and 30% = B, if smaller than 20% = C.
I have used a calculated dimension for the Margin, as follows:
=if([Contributive Margin]<20,'C',if([Contributive Margin]>30,'A','B'))
That one works. Now I want to use a calculated dimension for the Sales as well.
However, I do not know how to fill in that one correctly...
I will include a small example Qlikview-file I have built, as to clarify it further.
It uses the same data as the small example table above. I will add that Excel-file as well  .
.
What I want to see in the end should look something like this:
This is based on the data in the Excel file and the QV-file.
If anyone could look into this, that would be great!
If you have any questions, please ask! .
And ofcourse, thanks in advance!
Accepted Solutions
- Mark as New
- Bookmark
- Subscribe
- Mute
- Subscribe to RSS Feed
- Permalink
- Report Inappropriate Content
hi Stefan,
I'd strongly recommend you to avoid calculated dimensions, as it is memory intensive and can degrade the user experience.
I attached a possible solution, migrating the calculations to the script. Check it out and let me know what you think...
Hope this helps you.
Regards,
Fernando
- Mark as New
- Bookmark
- Subscribe
- Mute
- Subscribe to RSS Feed
- Permalink
- Report Inappropriate Content
Hello Fernando,
brilliant solution, never thought it would be possible in the script as well .
Thank you very much for your help .
If I may, I would like to ask one more question:
Do you know a way to show the number which gives the bubble it's size?
When I turn on 'Labels on Datapoints' in the Presentation Tab of the Grid Chart right now, it shows A, B or C.
I want it to say the number of products counted (in this example that would be 1 for eachb bubble).
You can see the number if you put your mousepointer on top of one of the bubbles (behind the "Count (Material - Code & Name" phrase).
Thanks again!
- Mark as New
- Bookmark
- Subscribe
- Mute
- Subscribe to RSS Feed
- Permalink
- Report Inappropriate Content
Hi Stefan,
sorry, I tried but can't help you with that. I'm not really used to using this kind of chart...
Why don't you create another discussion about this?
Regards,
Fernando
- Mark as New
- Bookmark
- Subscribe
- Mute
- Subscribe to RSS Feed
- Permalink
- Report Inappropriate Content
Hello Fernando,
thanks for trying
I already started a discussion, no responses yet I'm afraid 
Kind greetings,
Stefan