Unlock a world of possibilities! Login now and discover the exclusive benefits awaiting you.
- Qlik Community
- :
- All Forums
- :
- QlikView App Dev
- :
- Colour expression in a chart
- Subscribe to RSS Feed
- Mark Topic as New
- Mark Topic as Read
- Float this Topic for Current User
- Bookmark
- Subscribe
- Mute
- Printer Friendly Page
- Mark as New
- Bookmark
- Subscribe
- Mute
- Subscribe to RSS Feed
- Permalink
- Report Inappropriate Content
Colour expression in a chart
Hi all,
I'm having a problem presenting a chart using an expression for the column colour.
I have a bar chart that presents financial data that is broken down in various ways but mainly department, team, spend, budget and one of the views is Spend v Budget.
I work this out using calculation Sum (Costs)-((Sum (Budget))/12*Count (DISTINCT Month)), then the expression used to display the chart colour is if(($(vVar))>=0,Green(),Red()) where vVar = Sum (Costs)-((Sum (Budget))/12*Count (DISTINCT Month)).
When you choose a team from a list box the chart will show green or red depending on the result of the selection so in that case it works fine.
The problem comes where the chart is shown with no team selected and is shown as departments - all bars, whether in the positive or negative financially show as red because the total variance for all budgets is a negative value.
Is there a simple way to show all fiigures above 0 in a chart as green and all those beneath 0 as red - or another way round this. If i'm not clear please let me know.
Thanks,
David
Accepted Solutions
- Mark as New
- Bookmark
- Subscribe
- Mute
- Subscribe to RSS Feed
- Permalink
- Report Inappropriate Content
- Mark as New
- Bookmark
- Subscribe
- Mute
- Subscribe to RSS Feed
- Permalink
- Report Inappropriate Content
Hi,
You can use the expression which you used in the calculation like this
For example:
ExpressionName = Sum (Costs)-((Sum (Budget))/12*Count (DISTINCT Month))
Color Expression:
if((ExpressionName)>=0,Green(),Red())
Regards,
Jagan.
- Mark as New
- Bookmark
- Subscribe
- Mute
- Subscribe to RSS Feed
- Permalink
- Report Inappropriate Content
Hi,
Thanks for your response, but thats what i've already done. I don't think i was clear in my OP.
That works exactly as it should, showing positive values as green and negative values as red - but only when a selection is made in a list box.
When the chart is showing the data with no selections in the list box all values show as red, even those that are a positive number. This is because Sum (Costs)-((Sum (Budget))/12*Count (DISTINCT Month)) is a negative value overall.
I need for the chart to show positive values as green and negative values as red even when no selection is made. I'm not sure if there is an easy way to do this in the chart properties, if I'm looking at variable to define variation per team without selections in list boxes or some other way?
Thanks,
David.
- Mark as New
- Bookmark
- Subscribe
- Mute
- Subscribe to RSS Feed
- Permalink
- Report Inappropriate Content
Hi,
I think you are using calculated value in the variable in your expression.
Try removing the "=" sign in the variable declaration.
Attach sample file, it helps in solving the problem.
Hope this helps you.
Regards,
Jagan.
- Mark as New
- Bookmark
- Subscribe
- Mute
- Subscribe to RSS Feed
- Permalink
- Report Inappropriate Content
Hi,
I've attached a sample file, hopefully it will highlight what i am trying to do.
There is also a text box explaining what i'm looking for on the sheet.
Thanks,
David.
- Mark as New
- Bookmark
- Subscribe
- Mute
- Subscribe to RSS Feed
- Permalink
- Report Inappropriate Content
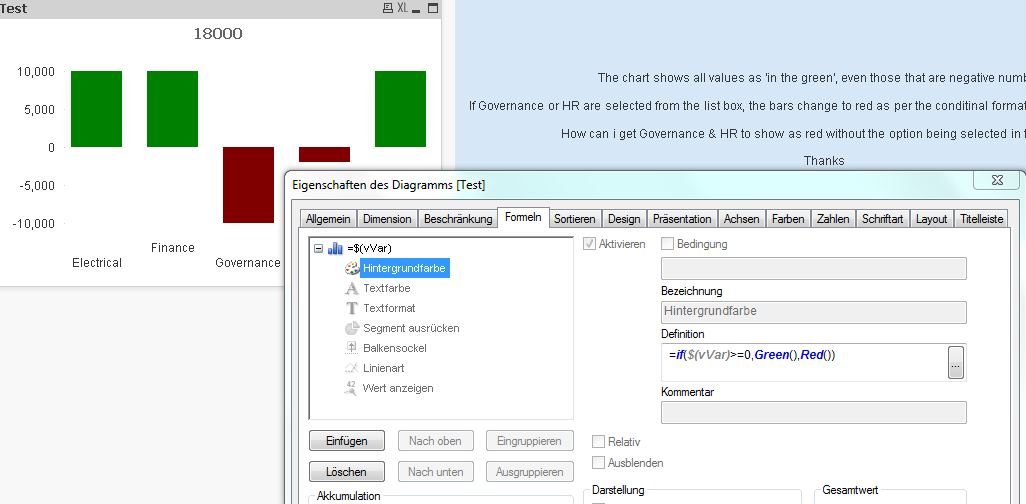
Hi,
here are the right place for your expression.
Good luck!
Rainer
- Mark as New
- Bookmark
- Subscribe
- Mute
- Subscribe to RSS Feed
- Permalink
- Report Inappropriate Content
Hi,
Please check the attachment.
Regards,
Jagan.
- Mark as New
- Bookmark
- Subscribe
- Mute
- Subscribe to RSS Feed
- Permalink
- Report Inappropriate Content
Brilliant, i was putting the condition in the colour tab by mistake.
Thanks for your help Jagan & Rainer.
- Mark as New
- Bookmark
- Subscribe
- Mute
- Subscribe to RSS Feed
- Permalink
- Report Inappropriate Content
Hello David,
If you go to the expression and expand the +, you will see options to add formulae for various attributes of the expression. Select the background colour and enter the expression that you have placed in the colours tab in the dialogue box on the right.
see your updated sample file attached.
I hope this helps.