Unlock a world of possibilities! Login now and discover the exclusive benefits awaiting you.
- Qlik Community
- :
- All Forums
- :
- QlikView App Dev
- :
- How to set up a fixed bar in a barchart.
- Subscribe to RSS Feed
- Mark Topic as New
- Mark Topic as Read
- Float this Topic for Current User
- Bookmark
- Subscribe
- Mute
- Printer Friendly Page
- Mark as New
- Bookmark
- Subscribe
- Mute
- Subscribe to RSS Feed
- Permalink
- Report Inappropriate Content
How to set up a fixed bar in a barchart.
Hi together, I'm new to the QV. Could anybody help me with my question how to get a fixed bar for Budgeted figures and figures for the Last year in a chart together with the Actual figures, that could be changed based on the actual month?
Thanks a lot
- Mark as New
- Bookmark
- Subscribe
- Mute
- Subscribe to RSS Feed
- Permalink
- Report Inappropriate Content
You can represent your budget on a bar chart by adding a second expression with the value of your monthly budget.
Alternatively I would use a reference line. You can find them towards the bottom right of the presentation tab in the chart properties.
- Mark as New
- Bookmark
- Subscribe
- Mute
- Subscribe to RSS Feed
- Permalink
- Report Inappropriate Content
The Budget together with Last year volumes are based on the whole year, but the actual figures will be shown monthly. The other problem is that I need to use two dimensions the Version (actual, forecast, budget, last year, projection) and than a different type of "Hartegrad".
- Mark as New
- Bookmark
- Subscribe
- Mute
- Subscribe to RSS Feed
- Permalink
- Report Inappropriate Content
Are you looking to have the monthly actuals accumulate to the yearly total which you can compare against the yearly budget? Or are you wanting to divide the yearly budget by 12?
As for the 2 dimensions, are you wanting to switch between the 2 or have them both in the same chart?
- Mark as New
- Bookmark
- Subscribe
- Mute
- Subscribe to RSS Feed
- Permalink
- Report Inappropriate Content
according to the monthly actuals they will be already in the data sheet as cummulative values for each month, and the yearly budget should be always swhown as yearly value so dont't need to divide it by 12.
regarding the two dimensions I'd like to show it as an stacked bar chart.
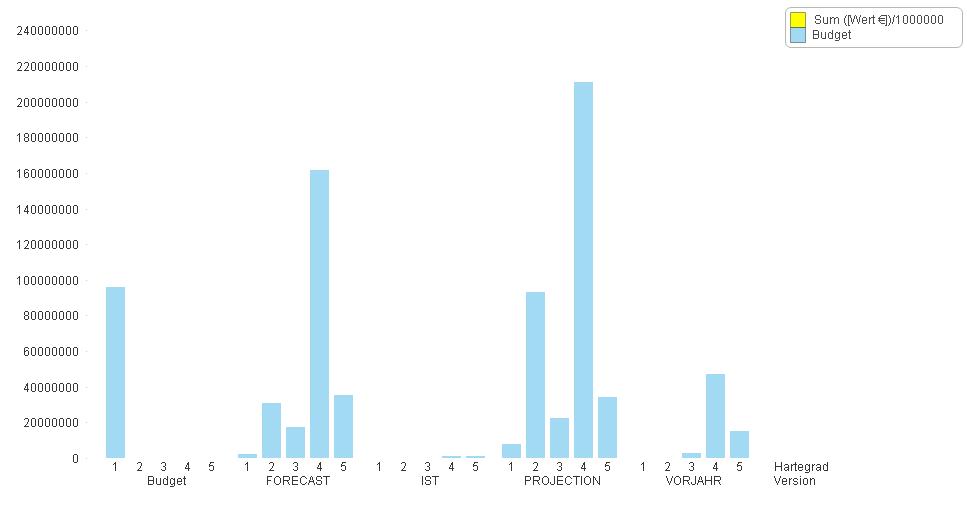
here's an exemple of the chart:
- i need to have the "budget" and "Vorjahr" to be fixed an not to change when I'm changing the Month in the list box (there will be also a list box for the year), the other 3 Bars should depend on the month and year selection.
- the actual will be added each month as a cummulative value, the Projection and Forecast will be also updated for each month as a yearly value
- the picture is showing all values when only Year 2012 is selected, at the time I will checked one of the months for example January I will lost the date for "Budget" and "Vorjahr "
- the year and date fields in the source data are organized as follows (whole year values have no month in the month field):
VORJAHR | 2012 |
|
VORJAHR | 2012 |
|
FORECAST | 2012 | Jan |
FORECAST | 2012 | Jan |
PROJECTION | 2012 | Jan |
PROJECTION | 2012 | Jan |
Budget | 2012 |
|
Budget | 2012 |
|
- Mark as New
- Bookmark
- Subscribe
- Mute
- Subscribe to RSS Feed
- Permalink
- Report Inappropriate Content
Hi,
Try this expression for Budget
=Sum({<Year={$(=Max(Year))}, Month=, Quarter=, Week=>} Budget)
Month=,
Quarter=,
Week=
will exclude the selections of Month, Quarter and Week.
Hope this helps you.
Regards,
Jagan.
- Mark as New
- Bookmark
- Subscribe
- Mute
- Subscribe to RSS Feed
- Permalink
- Report Inappropriate Content
Hi,
thanks for your reply. I have add following expresion for the Budget:
sum ({<Jahr={$(=Max(Jahr))}, Tmonat=>} [Wert €])
which is solving the issue that Budget is now fixed when I'm changing the Months, but i tried to do the same for the "Vorjahr" and it doesnt worked.
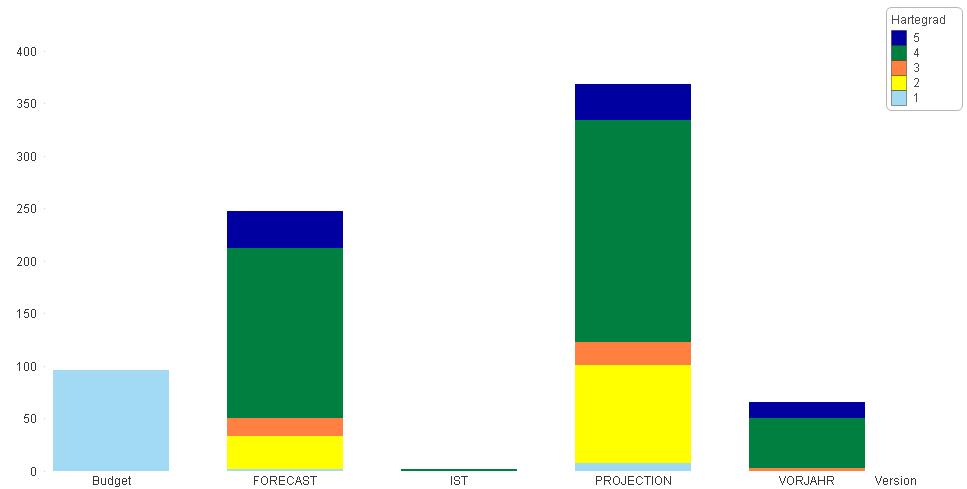
The another problem now is, that all Bars are now fixed and dont change with the Month change. I also had to disable my first expression
sum ( [Wert €])/1000000
because than I got following chart: