Unlock a world of possibilities! Login now and discover the exclusive benefits awaiting you.
- Qlik Community
- :
- Discover
- :
- About
- :
- Water Cooler
- :
- Run script Tab into a Secondary sheet
- Subscribe to RSS Feed
- Mark Topic as New
- Mark Topic as Read
- Float this Topic for Current User
- Bookmark
- Subscribe
- Mute
- Printer Friendly Page
- Mark as New
- Bookmark
- Subscribe
- Mute
- Subscribe to RSS Feed
- Permalink
- Report Inappropriate Content
Run script Tab into a Secondary sheet
I have a Main sheet and i want to have a second sheet that loads different data than in the Main sheet
Reason why i wanna do this is, i have two different types of data in one colum(CPU Usage, Load Average), i want to use CPU usage data on one sheet and the Load average on the other. Is their anyway i can Link the Run/Load script to a specific sheet and have it pull certain data from either a xls file or from sql without affecting the other sheets?
Any help or advice would be most appreciated
Thank you
Bongkerz
Accepted Solutions
- Mark as New
- Bookmark
- Subscribe
- Mute
- Subscribe to RSS Feed
- Permalink
- Report Inappropriate Content
Start with the following and see if it does the trick.
It will generate two, unconnected tables. If you want to connect them anyway, you can do this by removing the comments on the four lines that I have commented out.
/HIC
[CPU-Utilization]:
Load
Metric as [CPU-Utilization],
DATE as [CPU-Utilization TimeStamp],
// Date(Floor(DATE)) as [Date],
// Host,
Value as [CPU-Utilization Value]
where Left(Metric,4) = 'CPU-';
SQL SELECT * FROM <YourTable> ;
[Load Average]:
Load
Metric as [Load Average],
DATE as [Load Average TimeStamp],
// Date(Floor(DATE)) as [Date],
// Host,
Value as [Load Average Value]
where Left(Metric,4) = 'Load';
SQL SELECT * FROM <YourTable> ;
- Mark as New
- Bookmark
- Subscribe
- Mute
- Subscribe to RSS Feed
- Permalink
- Report Inappropriate Content
No, there is no way to have a script dedicated for one sheet.
But you can have a script that loads data from different, unconnected sources and choose to show fields from source A on the first sheet and fields from source B on the second.
/HIC
- Mark as New
- Bookmark
- Subscribe
- Mute
- Subscribe to RSS Feed
- Permalink
- Report Inappropriate Content
Ok thanks Henric, Could you please show or explain to me how i would do that, im fairly new to qlikview and still learing how to use the application. And do you possible know how to pull different data from one column and show or use that data, similar to using a like statement in sql. but still being able to use the other data.
Thank you
Bongkerz
- Mark as New
- Bookmark
- Subscribe
- Mute
- Subscribe to RSS Feed
- Permalink
- Report Inappropriate Content
im still realy battleing with this, ive tried using a nested sql statement within qlikview to try and be able to use the two different data's in the one column but qlikview only gives me one of the two data's i want, tried to create a new table in sql for one of the data's in the column but then im left with 20 000 null vales so that approach wasnt possible, i need to be able to create graphs for both types of data in that one column but they need to be seperate, can anyone please help me figure this out or point me in the right direction, i dont want to be spoonfed just a clue or hint as to how i could do this.
thank you
Bongkerz
- Mark as New
- Bookmark
- Subscribe
- Mute
- Subscribe to RSS Feed
- Permalink
- Report Inappropriate Content
The first part is easy: If you have two (or more) Load/Select statements that have no field names in common, then you have effectively loaded two independent data sources. After this it is just a matter of which fields you choose to display on the different sheets.
For the second part, I do not quite understand what you are trying to do. But if you in the script want to restrict which data to load there are several ways:
Load ... where Exists(<Field>) ;
will compare the value of <Field> with the values already existing in this field.
Load ... where Match(<Field>,'A','B','C') ;
will compare the value of <Field> with 'A','B' and 'C', much like SQL "LIKE"
/HIC
- Mark as New
- Bookmark
- Subscribe
- Mute
- Subscribe to RSS Feed
- Permalink
- Report Inappropriate Content
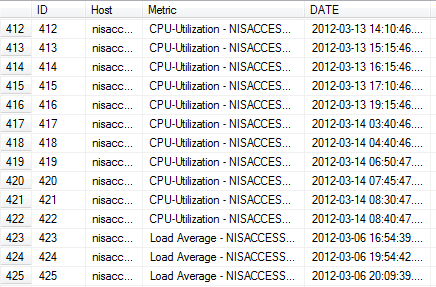
Il give that a try and see if can get something working for me. As for the part you dont undertsand, here is a image that might help, below is the data il be using in qlikview, the ID column is not important and isnt needed, however their is a Value column after Date which you cannot see and will be the main value for the reports im trying to produce, anyway as you can see in the Metric column their is different data ( CPU - Utilization & Load Average) and each has different server names. I wanna use all the CPU data for one graph and all the Load average in another, im not sure how to pull each of these out and use just that data without pulling the other, i want seperate graphs for CPU and Load Average and not have both data in the same graph. Hope that clears things a bit for you.
- Mark as New
- Bookmark
- Subscribe
- Mute
- Subscribe to RSS Feed
- Permalink
- Report Inappropriate Content
Start with the following and see if it does the trick.
It will generate two, unconnected tables. If you want to connect them anyway, you can do this by removing the comments on the four lines that I have commented out.
/HIC
[CPU-Utilization]:
Load
Metric as [CPU-Utilization],
DATE as [CPU-Utilization TimeStamp],
// Date(Floor(DATE)) as [Date],
// Host,
Value as [CPU-Utilization Value]
where Left(Metric,4) = 'CPU-';
SQL SELECT * FROM <YourTable> ;
[Load Average]:
Load
Metric as [Load Average],
DATE as [Load Average TimeStamp],
// Date(Floor(DATE)) as [Date],
// Host,
Value as [Load Average Value]
where Left(Metric,4) = 'Load';
SQL SELECT * FROM <YourTable> ;
- Mark as New
- Bookmark
- Subscribe
- Mute
- Subscribe to RSS Feed
- Permalink
- Report Inappropriate Content
Thank you Henric,
thats exactly what i wanted, i went the long way and made a seperate table in sql for the data, but this works perfectly.
Thank you