Unlock a world of possibilities! Login now and discover the exclusive benefits awaiting you.
- Qlik Community
- :
- All Forums
- :
- QlikView App Dev
- :
- Graph issue
- Subscribe to RSS Feed
- Mark Topic as New
- Mark Topic as Read
- Float this Topic for Current User
- Bookmark
- Subscribe
- Mute
- Printer Friendly Page
- Mark as New
- Bookmark
- Subscribe
- Mute
- Subscribe to RSS Feed
- Permalink
- Report Inappropriate Content
Graph issue
Hi
I have graph that can hold many values, but in current size it does noe show all values.
Looking at the picture below we can se the correct start, but the finish is actually at a later time.
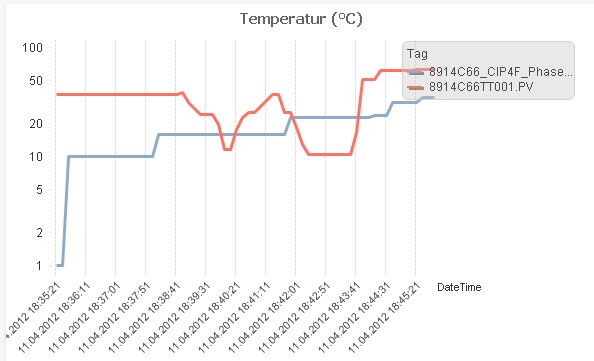
If i maximize the graph window it shoes all date values. Abit hard to see in the picture below, but the actual stop time is 18:57.
I nned to be able to get the correct start and finish time in the smal window. Do not need all measuring points. That I get by maximize.
I have 4 different graphs that will show in one window.
In order to compare the different graphs I need to be able to look at the entire timelap at once, for each of them.
Any ideas?
Best regards
Dan
- Mark as New
- Bookmark
- Subscribe
- Mute
- Subscribe to RSS Feed
- Permalink
- Report Inappropriate Content
Try checking the "Continuous" box in the presentation tab.
Hope this helps,
Jason