Unlock a world of possibilities! Login now and discover the exclusive benefits awaiting you.
- Qlik Community
- :
- All Forums
- :
- QlikView App Dev
- :
- Use of inter record functions in calculated diment...
- Subscribe to RSS Feed
- Mark Topic as New
- Mark Topic as Read
- Float this Topic for Current User
- Bookmark
- Subscribe
- Mute
- Printer Friendly Page
- Mark as New
- Bookmark
- Subscribe
- Mute
- Subscribe to RSS Feed
- Permalink
- Report Inappropriate Content
Use of inter record functions in calculated dimention
Hi all,
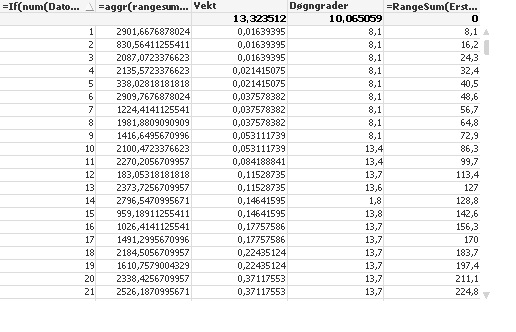
I have a table like the one below. The columns are as follows:
1. date - startdate (i.e. days between start and measurement)
2. =aggr(rangesum(above(Avg(ErstattetTemperatur),0,rowno())),Dato) (This is the one giving me grief)
3. =avg(Sluttvekt) i.e average weight that day
4. =Avg(ErstattetTemperatur) i.e. average temperature that day
5. =RangeSum(ErstattetTemperatur,Above(TOTAL Column(3))) i.e. accumulated daydegrees (running sum of average temperature).
The first two columns are dimensions, and the three last ones are expressions.
My challange is to make a scatter plot of column 5 vs 3, where the division of points is based on column 1. The others are just there temporarily for the purpose of getting this correctly.
As I understand it, I need to make column 5 into a calculated dimension (which is what i tried in column 2). So my question is simply, how can I get the same values as I have in column 5 into a calculated dimension?
Any suggestions are highly appreciated!
Regards,
Ståle