Unlock a world of possibilities! Login now and discover the exclusive benefits awaiting you.
- Qlik Community
- :
- All Forums
- :
- QlikView App Dev
- :
- Min and Max reference lines on chart - Min incorre...
- Subscribe to RSS Feed
- Mark Topic as New
- Mark Topic as Read
- Float this Topic for Current User
- Bookmark
- Subscribe
- Mute
- Printer Friendly Page
- Mark as New
- Bookmark
- Subscribe
- Mute
- Subscribe to RSS Feed
- Permalink
- Report Inappropriate Content
Min and Max reference lines on chart - Min incorrect when using Aggr expression
Hi,
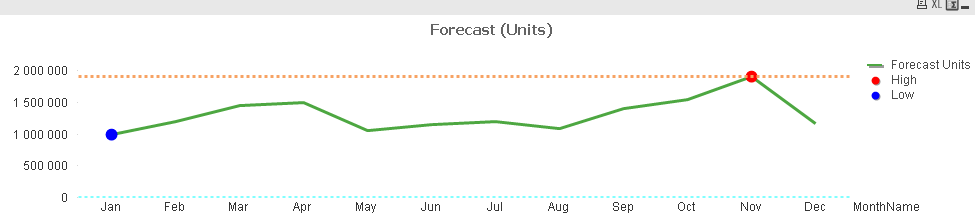
From the attached QVW I'm getting a 0 plot line for the Minimum value - I expect the light blue dotted line to be plotting at the 1000 0000 level below, but its plotting at 0. QVW is also doing a button toggle between 2 calculations hence the If$(vChange) part but this works fine for the Max value plot. However, when I use the identical expression just replacing the Max function with a Min, it doesnt plot correctly. What do I need to do to I fix the Min level formula? Thanks
I based what I have so far on the example QVW's of John Witherspoon, http://community.qlik.com/message/103391#103391 and http://community.qlik.com/message/23455#23455
The Max formula which works - orange dotted line.
If($(vChange)=1, Max(Aggr(Sum({$<recordGroupName={'Forecast'},YearName={2012}>}Forecast),MonthName)) , Max(Aggr(Sum({$<recordGroupName={'Forecast'},YearName={2012}>}Forecast*PackSize),MonthName)) )
The errant formula - light blue dotted line.
If($(vChange)=1, Min(Aggr(Sum({$<recordGroupName={'Forecast'},YearName={2012}>}Forecast),MonthName)) , Min(Aggr(Sum({$<recordGroupName={'Forecast'},YearName={2012}>}Forecast*PackSize),MonthName)) )