Unlock a world of possibilities! Login now and discover the exclusive benefits awaiting you.
- Qlik Community
- :
- All Forums
- :
- QlikView App Dev
- :
- TimeLine chart by time(Row) Employee (Column) Type...
- Subscribe to RSS Feed
- Mark Topic as New
- Mark Topic as Read
- Float this Topic for Current User
- Bookmark
- Subscribe
- Mute
- Printer Friendly Page
- Mark as New
- Bookmark
- Subscribe
- Mute
- Subscribe to RSS Feed
- Permalink
- Report Inappropriate Content
TimeLine chart by time(Row) Employee (Column) Type (downtime Travel etc) for 1 day etc
I have set up a table as shown below
This include
start and finish driving information from Tom-tom Satnav and
Start and finish information from the engineers data input for various call outs (for warranty and other repairs on company equipment)
I have been asked for a daily bar ? chart with
-The time on one axis (say the horizontal from 6 am to 9pm)
- The engineers on another one (vertical)
- The hours worked in the graph itself. With one line per engineer showing
Hours not worked in one colour (say grey)
Tom-tom driving hours in another one (say red)
Engineers work on job in another one (say blue)
Pverlap hours in another one (say black)
If possible could someone point me in the right direction
Thanks for any help
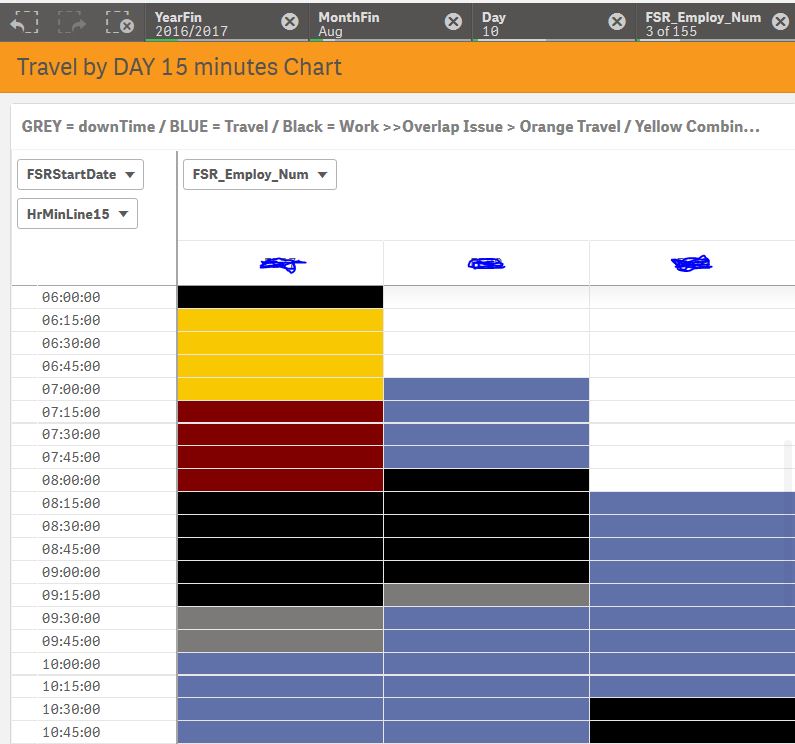
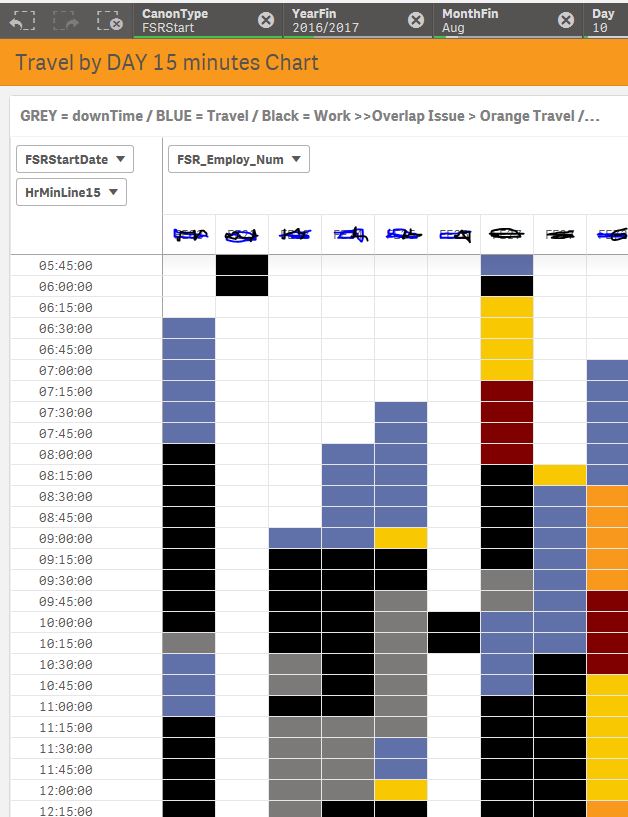
For a service after sales repair company
Blue = Travel Time
Grey = downtime
Black = work Time
Orange = overlap on travel time
Yellow = overlap on travel and work
Red = overlap on work
Accepted Solutions
- Mark as New
- Bookmark
- Subscribe
- Mute
- Subscribe to RSS Feed
- Permalink
- Report Inappropriate Content
Steps (for a cloud client where extensions are not available yet)
SCRIPT
Step one Concatenate data three times.
1 Work Time
2 Travel Time
3 Down time where every call out is set as start timestamp at 00:00:00 and every complete timestamp at 59:59:59 (using daystart and day end) >>> required to have downtime as grey and out of work time as white. Otherwise gaps appear in the pivot table)
Step 2 Added Max Min TimesStamp to table
MaxMinDate:
LEFT JOIN (SCFSR)
load
FSR_Employ_Num ,
FSRStartDate ,
max (FSRCompleteTime ) as MaxCompleteStamp ,
mIN (FSRStartTime ) as MinStartStamp
resident SCFSR
GROUP BY FSR_Employ_Num , FSRStartDate ;
Also a Time field must be included for start and finish times
time(Frac(FSR_Start_Date)) as FSRStartTime ,
time( Frac(FSR_Complete_Date)) as FSRCompleteTime ,
step 3 Set up one days timeline only (for whatever is required. 15 minutes or whatever)
TimeLine15:
Load * Inline [
HrMinLine15
00:00:00
00:15:00
00:30:00
00:45:00
01:00:00
01:15:00
01:30:00
01:45:00
02:00:00
02:15:00
alternatively if a longer period (months / Year) is required or just one day. 288 gives 5 minutes intervals.
Timeline5:
//level 3
load timestamp (Timeline1 / 288) as HrMinLine5;
//level 2
Load timestamp (MinDate * 288 + (iterno()) ) as Timeline1 While iterno() <= MaxDate *288 - MinDate *288 ;
//level 1
Load Timestamp (today() -30) as MinDate, Max(today()) as MaxDate resident SCCall ;
Step 4
MatchHrMin15:
IntervalMatch (HrMinLine15)
Load
FSRStartTime ,
FSRCompleteTime
resident SCFSR
;
Pivot table expressions
Main Measure
count ({<GroupTime = {DownTime}, Year = {2017,2018}>} distinct FSR_Employ_Num)
+ count ({<GroupTime = {TravelTime},Year = {2017,2018}>} FSR_Employ_Num)
+ count ({<GroupTime = {WorkTime} ,Year = {2017,2018}>} FSR_Employ_Num) *10
background and text color expressions
IF (count ({<GroupTime = {DownTime}>} distinct FSR_Employ_Num) *1
+ count ({<GroupTime = {TravelTime}>} FSR_Employ_Num)
+ count ({<GroupTime = {WorkTime}>} FSR_Employ_Num) *10
= 2 ,
QlikTechBlue() ,
IF (count ({<GroupTime = {DownTime}>} distinct FSR_Employ_Num) *1
+ count ({<GroupTime = {TravelTime}>} FSR_Employ_Num)
+ count ({<GroupTime = {WorkTime}>} FSR_Employ_Num) *10
= 3 ,
'#F8981d' , //ORANGE
IF (count ({<GroupTime = {DownTime}>} distinct FSR_Employ_Num) *1
+ count ({<GroupTime = {TravelTime}>} FSR_Employ_Num)
+ count ({<GroupTime = {WorkTime}>} FSR_Employ_Num) *10
=11,
Black() ,
IF (count ({<GroupTime = {DownTime}>} distinct FSR_Employ_Num) *1
+ count ({<GroupTime = {TravelTime}>} FSR_Employ_Num)
+ count ({<GroupTime = {WorkTime}>} FSR_Employ_Num) *10
=12 ,
'#f8c902' , //YELLOW
IF (count ({<GroupTime = {DownTime}>} distinct FSR_Employ_Num) *1
+ count ({<GroupTime = {TravelTime}>} FSR_Employ_Num)
+ count ({<GroupTime = {WorkTime}>} FSR_Employ_Num) *10
=13 ,
'#f8c902' , //YELLOW
IF (count ({<GroupTime = {DownTime}>} distinct FSR_Employ_Num) *1
+ count ({<GroupTime = {TravelTime}>} FSR_Employ_Num)
+ count ({<GroupTime = {WorkTime}>} FSR_Employ_Num) *10
=4 ,
'#f8c902' , //YELLOW
IF (count ({<GroupTime = {DownTime}>} distinct FSR_Employ_Num) *1
+ count ({<GroupTime = {TravelTime}>} FSR_Employ_Num)
+ count ({<GroupTime = {WorkTime}>} FSR_Employ_Num) *10
=21 ,
RED() ,
IF (count ({<GroupTime = {DownTime}>} distinct FSR_Employ_Num) *1
+ count ({<GroupTime = {TravelTime}>} FSR_Employ_Num)
+ count ({<GroupTime = {WorkTime}>} FSR_Employ_Num) *10
=22 ,
RED() ,
IF (COUNT (
IF(HrMinLine15 < FRAC (MaxCompleteStamp) and HrMinLine15 > FRAC (MinStartStamp) ,(HrMinLine15)))>1000 ,'#7B7A78' , //GREY
IF (count ({<GroupTime = {DownTime}>} distinct FSR_Employ_Num) *1
+ count ({<GroupTime = {TravelTime}>} FSR_Employ_Num)
+ count ({<GroupTime = {WorkTime}>} FSR_Employ_Num) *10
=1 ,
WHITE(),
'#8E477D' ))))))))))
- Mark as New
- Bookmark
- Subscribe
- Mute
- Subscribe to RSS Feed
- Permalink
- Report Inappropriate Content
- Mark as New
- Bookmark
- Subscribe
- Mute
- Subscribe to RSS Feed
- Permalink
- Report Inappropriate Content
Hi
I cannot see your image. Could you please re-post it using another location?
Regards
Jonathan
- Mark as New
- Bookmark
- Subscribe
- Mute
- Subscribe to RSS Feed
- Permalink
- Report Inappropriate Content
How about this one below
All the image shows is the start and finish time for an enginner
So as per Tom Tom
Start TomTom 8.57am
Stop TomTom 9.53am
Start Call repair 10.00
Stop Call repair 10.35
Start TomTom 8.57am
Stop TomTom 9.53am
And so on for the full day
But there are overlaps at times ie the call would stop at say 11.00 but according to Tomtom the engineer was back on the road at say 10.25
I need a graph to quickly highlight these overlaps along with hours worked on site v driving. And any unexplained down time
| Engineer | Start Time | FinishTime | Group |
| 003 | 29/07/11 08:57 | 29/07/11 09:53 | Tom Tom |
| 003 | 29/07/11 10:00 | 29/07/11 10:35 | Call |
| 003 | 29/07/11 10:38 | 29/07/11 10:59 | TomTom |
| 003 | 29/07/11 11:00 | 29/07/11 12:00 | Call |
| 003 | 29/07/11 11:49 | 29/07/11 12:09 | TomTom |
| 003 | 29/07/11 12:15 | 29/07/11 12:25 | TomTom |
| 003 | 29/07/11 12:49 | 29/07/11 13:37 | TomTom |
| 003 | 29/07/11 13:30 | 29/07/11 14:50 | Call |
- Mark as New
- Bookmark
- Subscribe
- Mute
- Subscribe to RSS Feed
- Permalink
- Report Inappropriate Content
Here's how it done (Im still learning but this is quite simple really)
The first step was to load a series of dates.
I just set this up in excel and loaded in 5 minute intervals (NB 15 min was too long as time was not booked on the hour and that means 7am + 1 min would not start until 7am + 15 minutes ) for a month (or year or whatever is needed)
Time
15/7/2012 6:00
15/7/2012 6.05
15/7/2012 6.10 etc
This was then loaded into QV
Step 2 was to link these dates to the engineer start and finish time fields
As load script as follows
Match:
IntervalMatch (Time) load StartTime,FinishTime resident EngineerTime;
Step 3. After loading set up a chart Pivot table with
Dimensions
Time
Engineer
Expression
Count (Engineer)+count (if(Group ='TomTom',Engineer))
This now gives
Overlap time = 3
TomTom hours = 2
Work time = 1
Downtime = 0
Set Time on one axis and Engineer on another one
Step 4
Use the chart option visual clues to colour the expression in the same colour for text and background
So
text might equal grey and grey
lower = 1 = green and green (driving time)
Normal = 2 = Blue and blue (work time
Upper = 3 = Red and red = Overlap
- Mark as New
- Bookmark
- Subscribe
- Mute
- Subscribe to RSS Feed
- Permalink
- Report Inappropriate Content
Steps (for a cloud client where extensions are not available yet)
SCRIPT
Step one Concatenate data three times.
1 Work Time
2 Travel Time
3 Down time where every call out is set as start timestamp at 00:00:00 and every complete timestamp at 59:59:59 (using daystart and day end) >>> required to have downtime as grey and out of work time as white. Otherwise gaps appear in the pivot table)
Step 2 Added Max Min TimesStamp to table
MaxMinDate:
LEFT JOIN (SCFSR)
load
FSR_Employ_Num ,
FSRStartDate ,
max (FSRCompleteTime ) as MaxCompleteStamp ,
mIN (FSRStartTime ) as MinStartStamp
resident SCFSR
GROUP BY FSR_Employ_Num , FSRStartDate ;
Also a Time field must be included for start and finish times
time(Frac(FSR_Start_Date)) as FSRStartTime ,
time( Frac(FSR_Complete_Date)) as FSRCompleteTime ,
step 3 Set up one days timeline only (for whatever is required. 15 minutes or whatever)
TimeLine15:
Load * Inline [
HrMinLine15
00:00:00
00:15:00
00:30:00
00:45:00
01:00:00
01:15:00
01:30:00
01:45:00
02:00:00
02:15:00
alternatively if a longer period (months / Year) is required or just one day. 288 gives 5 minutes intervals.
Timeline5:
//level 3
load timestamp (Timeline1 / 288) as HrMinLine5;
//level 2
Load timestamp (MinDate * 288 + (iterno()) ) as Timeline1 While iterno() <= MaxDate *288 - MinDate *288 ;
//level 1
Load Timestamp (today() -30) as MinDate, Max(today()) as MaxDate resident SCCall ;
Step 4
MatchHrMin15:
IntervalMatch (HrMinLine15)
Load
FSRStartTime ,
FSRCompleteTime
resident SCFSR
;
Pivot table expressions
Main Measure
count ({<GroupTime = {DownTime}, Year = {2017,2018}>} distinct FSR_Employ_Num)
+ count ({<GroupTime = {TravelTime},Year = {2017,2018}>} FSR_Employ_Num)
+ count ({<GroupTime = {WorkTime} ,Year = {2017,2018}>} FSR_Employ_Num) *10
background and text color expressions
IF (count ({<GroupTime = {DownTime}>} distinct FSR_Employ_Num) *1
+ count ({<GroupTime = {TravelTime}>} FSR_Employ_Num)
+ count ({<GroupTime = {WorkTime}>} FSR_Employ_Num) *10
= 2 ,
QlikTechBlue() ,
IF (count ({<GroupTime = {DownTime}>} distinct FSR_Employ_Num) *1
+ count ({<GroupTime = {TravelTime}>} FSR_Employ_Num)
+ count ({<GroupTime = {WorkTime}>} FSR_Employ_Num) *10
= 3 ,
'#F8981d' , //ORANGE
IF (count ({<GroupTime = {DownTime}>} distinct FSR_Employ_Num) *1
+ count ({<GroupTime = {TravelTime}>} FSR_Employ_Num)
+ count ({<GroupTime = {WorkTime}>} FSR_Employ_Num) *10
=11,
Black() ,
IF (count ({<GroupTime = {DownTime}>} distinct FSR_Employ_Num) *1
+ count ({<GroupTime = {TravelTime}>} FSR_Employ_Num)
+ count ({<GroupTime = {WorkTime}>} FSR_Employ_Num) *10
=12 ,
'#f8c902' , //YELLOW
IF (count ({<GroupTime = {DownTime}>} distinct FSR_Employ_Num) *1
+ count ({<GroupTime = {TravelTime}>} FSR_Employ_Num)
+ count ({<GroupTime = {WorkTime}>} FSR_Employ_Num) *10
=13 ,
'#f8c902' , //YELLOW
IF (count ({<GroupTime = {DownTime}>} distinct FSR_Employ_Num) *1
+ count ({<GroupTime = {TravelTime}>} FSR_Employ_Num)
+ count ({<GroupTime = {WorkTime}>} FSR_Employ_Num) *10
=4 ,
'#f8c902' , //YELLOW
IF (count ({<GroupTime = {DownTime}>} distinct FSR_Employ_Num) *1
+ count ({<GroupTime = {TravelTime}>} FSR_Employ_Num)
+ count ({<GroupTime = {WorkTime}>} FSR_Employ_Num) *10
=21 ,
RED() ,
IF (count ({<GroupTime = {DownTime}>} distinct FSR_Employ_Num) *1
+ count ({<GroupTime = {TravelTime}>} FSR_Employ_Num)
+ count ({<GroupTime = {WorkTime}>} FSR_Employ_Num) *10
=22 ,
RED() ,
IF (COUNT (
IF(HrMinLine15 < FRAC (MaxCompleteStamp) and HrMinLine15 > FRAC (MinStartStamp) ,(HrMinLine15)))>1000 ,'#7B7A78' , //GREY
IF (count ({<GroupTime = {DownTime}>} distinct FSR_Employ_Num) *1
+ count ({<GroupTime = {TravelTime}>} FSR_Employ_Num)
+ count ({<GroupTime = {WorkTime}>} FSR_Employ_Num) *10
=1 ,
WHITE(),
'#8E477D' ))))))))))