Unlock a world of possibilities! Login now and discover the exclusive benefits awaiting you.
- Qlik Community
- :
- All Forums
- :
- QlikView App Dev
- :
- Converting pack level data tables to Aggr at unit ...
- Subscribe to RSS Feed
- Mark Topic as New
- Mark Topic as Read
- Float this Topic for Current User
- Bookmark
- Subscribe
- Mute
- Printer Friendly Page
- Mark as New
- Bookmark
- Subscribe
- Mute
- Subscribe to RSS Feed
- Permalink
- Report Inappropriate Content
Converting pack level data tables to Aggr at unit level output by dimension
Hi, I've been wrestling with this for days now so any ideas / solutions will be greatly appreciated.
I have created a simplified inline table data model of the database which I'll explain below. Essentially the data represents a sales forecast for garments sold in packs. Now each pack sold contains a "PackSize" number of garments and each garment (unit) can be a different colour. It could also be the same colour - e.g. a 3 pack of 3 white garments or 2 blue garments and a red garment making up a 3 pack say. The combination of colours within each pack is termed a "Mix" and this information is available in a separate table covering all possible mixes. The Colour and Mix data is also recorded in the Forecast table. As the data stands it creates synthetic keys because of this.
Each garment is identified by an "ItemId" number which is associated with an "itemReference" a description field for the itemId. Each item has a PackSize associated with it which is simply the number of units contained in that pack (the pack is what is sold)
[Inventory]:
LOAD * INLINE [
itemId, itemReference, PackSize
381, LFC0001, 2
456, ABC0002, 3
232, XYZ0003, 1
112, ZZZ0004, 1
334, AAA0005, 1
445, BBB0123, 4
];
Additional dimensions of the garment is its Colour or Mix. Well actually there's also size but I have removed that dimension that from my test example here. Sequence is the order in which the colours within a mix are packed, i.e. first, second, third, item in a pack, etc.
[ColourMix]:
LOAD * INLINE [
Mix, Colour, Sequence
MX0001, WHT0001, 1
MX0001, BLK0001, 2
MX0002, GRY0056, 1
MX0002, BLU0039, 2
MX0002, RED0022, 3
, BLU0039
, BLK0001
, PNK0005
MX0003, WHT0001, 1
MX0003, WHT0001, 2
MX0003, BLK0001, 3
MX0003, BLK0001, 4
The issue I have comes with the pack sizes and the colours within each pack. Working at the pack level is easy. But how do I adapt this data so that I can convert the data from packs to units and have drilldown by individual colour and get the forecast number of units value correct.
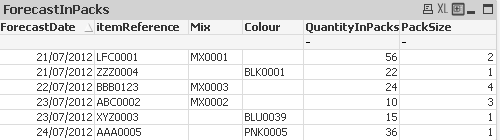
The quantity data looks like this
[Forecast]:
LOAD * INLINE [
ForecastDate, itemId, QuantityInPacks, Mix, Colour
21/07/2012, 381, 56, MX0001
23/07/2012, 456, 10, MX0002
23/07/2012, 232, 15, ,BLU0039
21/07/2012, 112, 22, ,BLK0001
24/07/2012, 334, 36, ,PNK0005
22/07/2012, 445, 24, MX0003
];
You can see the Mix and Colour information is duplicated in the Forecast table so possibly I don't need to even use the ColourMix table except to obtain the Sequence number (which I don't actually have much use for in reporting, so it could be left out).
The critical part though is that when Mix is null then the Colour field has a value and vice versa. When a colour field has a value then that implies that the mix is effectively a mix of 1 colour. However, in the data there isnt a combined mix and colour field. I have created one but I havent been able to use it to get to the results I'm looking for.
What I think I need to do is do the equivalent of a Bills of Materials (BOM) explosion for the Mix to break it down into individual Colours and then get everything quantity-wise to the equivalent of a PackSize of 1 for each exploded Colour (i.e. to the units) level. e.g. if I have an item called ABC which is made up of a Mix1 containing Red, Blue, Green and since the pack contains 3 colours that makes it a PackSize of 3 and this item has been forecast as having quantity 55 packs sold then in the data as units should look something like this: (Null) means the field is blank.
At the pack level:
Item Mix Colour PackSize Quantity
ABC Mix1 (Null) 3 55
At the unit level I'd like to get the data to show something like this. i.e. convert the pack quantity data into units.
Item Mix Colour PackSize Quantity
ABC Mix1 Red 1 55
ABC Mix1 Blue 1 55
ABC Mix1 Green 1 55
Now above the PackSize is not really 1 but at the units level it effectively should be treated as such, so that if I Sum the quantity I would get 55 Red, 55 Blue and 55 Green garments at the unit level making up 55 packs containing 3 garments in each pack (i.e. a 3-pack)
I have the code QVW below and screenshots.
This is a Mix vs Colours table where you can see a pivot table showing a Mix e.g. MX0001 broken down into its colour components of BLU39, GRY56 and RED22. For the 3 colours BLK0001, BLU0039, PNK0005 these do not have an associated Mix code - they are individual colours sold as a single pack garment item, i.e. the equivalent of having a mix of packsize of 1 and a mix containing a single colour. However, the data available separates colour and mix into separate columns.
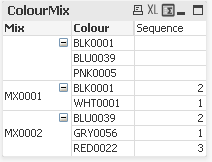
At the pack level the data is usable as it is.
How do I now get the above table to show the same type of data as above but at the Unit level with the correct quantity and if a filter selection on a particular colour is done to show only those individual colours and the parts of each mix that contain that colour and the forecast quantities associated with it?
The way I see it, individual colour drilldown with forecast quantity is only practically possible when viewing the data in units and would need to be disabled when viewing the data in packs.
- Mark as New
- Bookmark
- Subscribe
- Mute
- Subscribe to RSS Feed
- Permalink
- Report Inappropriate Content
I discovered in the QV manual mention of hierarchy load approaches, but these seem to apply to an adjacent nodes table. Is there any simplified example QVW on the community site or elsewhere that explains this because the manual is tricky to follow on this aspect.
If by adjacent the data needs to be side by side then I think I'm barking up the wrong tree in my attempt to do some sort of BOM explosion with the Mix -> Colour explosion above given how the data exists in the DB.
Previously I did create what I think is an adjacent table from the input data., i.e.
Mix Colour1inMix Colour2InMix Colour3InMix etc ...
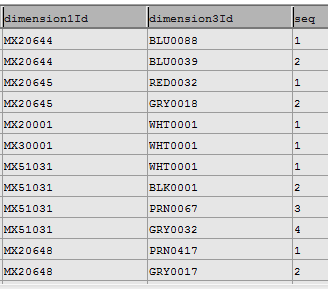
In the DB though, the ColourMix data looks like this: