Unlock a world of possibilities! Login now and discover the exclusive benefits awaiting you.
- Qlik Community
- :
- All Forums
- :
- QlikView App Dev
- :
- Using a Table Dimension as Filter
- Subscribe to RSS Feed
- Mark Topic as New
- Mark Topic as Read
- Float this Topic for Current User
- Bookmark
- Subscribe
- Mute
- Printer Friendly Page
- Mark as New
- Bookmark
- Subscribe
- Mute
- Subscribe to RSS Feed
- Permalink
- Report Inappropriate Content
Using a Table Dimension as Filter
Hi to evryone,
i have to create a document that use a dimension of the table (buyer) to select the buyer that must be showed in the graph.
The problem is that i have also a Multibox to select the buyers that must be showed in the table.
This is the screenshot of how i would like build the document.
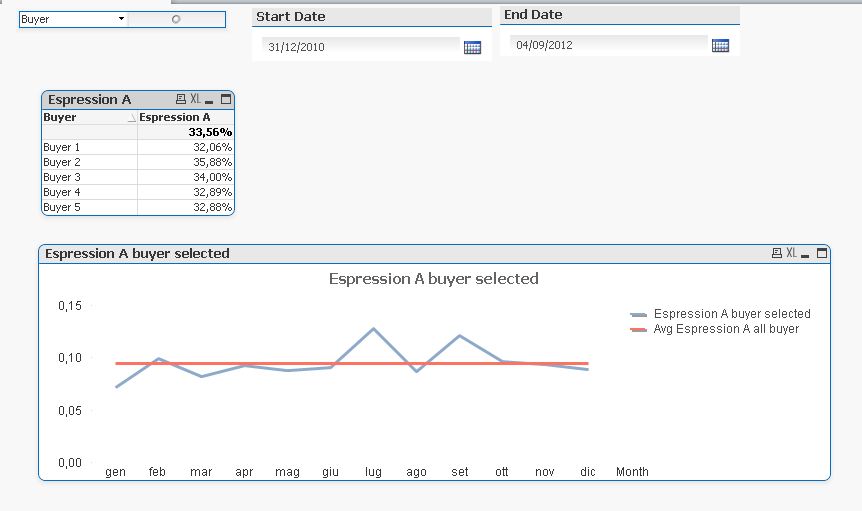
I want see in the graph the value of "Expression A" over the month just for one selected buyer
How can i make a selection of the buyer from the table that must be showed in the graph without change the buyer filter on the top and without change the field on the table?
Thanks
Alessio
- Mark as New
- Bookmark
- Subscribe
- Mute
- Subscribe to RSS Feed
- Permalink
- Report Inappropriate Content
If you expression A is Sum(Sales) then in the straight table chart above the line graph use the following expression instead:
Sum({<Buyer=>} Sales)
It is not so easy in the multibox but This will always show all Buyers anyway - the unselected ones in grey, selected in white. Isn't this better for you
Hope this helps,
Jason
- Mark as New
- Bookmark
- Subscribe
- Mute
- Subscribe to RSS Feed
- Permalink
- Report Inappropriate Content
Hi Jason,
but with your solution i can't use the multibox as selector for the table,right?
I tried and it's don't seems to work, or did i make something wrong?
- Mark as New
- Bookmark
- Subscribe
- Mute
- Subscribe to RSS Feed
- Permalink
- Report Inappropriate Content
Can you post your app please?
- Mark as New
- Bookmark
- Subscribe
- Mute
- Subscribe to RSS Feed
- Permalink
- Report Inappropriate Content
Here we are....
thank a lot in advance
Sorry but i am still using a personal edition so i hope you will be able to open it
- Mark as New
- Bookmark
- Subscribe
- Mute
- Subscribe to RSS Feed
- Permalink
- Report Inappropriate Content
What's the problem? Looks OK at a quick glance...
- Mark as New
- Bookmark
- Subscribe
- Mute
- Subscribe to RSS Feed
- Permalink
- Report Inappropriate Content
The problem is that i select in multibox ad example Buyer 1,2,3 in the table i see all buyer..
The graph instead work correctly when i click over the table..
- Mark as New
- Bookmark
- Subscribe
- Mute
- Subscribe to RSS Feed
- Permalink
- Report Inappropriate Content
And you don't want that? I thought you wanted to use the multibox to select a buyer...
- Mark as New
- Bookmark
- Subscribe
- Mute
- Subscribe to RSS Feed
- Permalink
- Report Inappropriate Content
Sorry,maybe i made a mess to explain my problem
I need to use the multibox to select the buyer that must be showed in the table,
For example i want to select in the multibox only Buyer 1, Buyer 2, Buyer 3 and in the table i want to see
Buyer Exp A
Buyer 1 10
Buyer 2 20
Buyer 3 30
Then if i click over the table The Buyer 2 i need to see in the graph the value of Exp A over month for Buyer 2.
But In the Table i need to see still buyer 1,2,3.
In the document that i sent to you, the table always show Buyer 1,2,3,4,5 also if i select in multibox just Buyer 1,2,3
I need to find a way to use the multibox as selector for only the table, and to use the table as selector for only the graph