Unlock a world of possibilities! Login now and discover the exclusive benefits awaiting you.
- Qlik Community
- :
- All Forums
- :
- QlikView App Dev
- :
- Show/Hide Text Boxes and Button
- Subscribe to RSS Feed
- Mark Topic as New
- Mark Topic as Read
- Float this Topic for Current User
- Bookmark
- Subscribe
- Mute
- Printer Friendly Page
- Mark as New
- Bookmark
- Subscribe
- Mute
- Subscribe to RSS Feed
- Permalink
- Report Inappropriate Content
Show/Hide Text Boxes and Button
I haven't found the solution to my problem so I'm now having to post it...
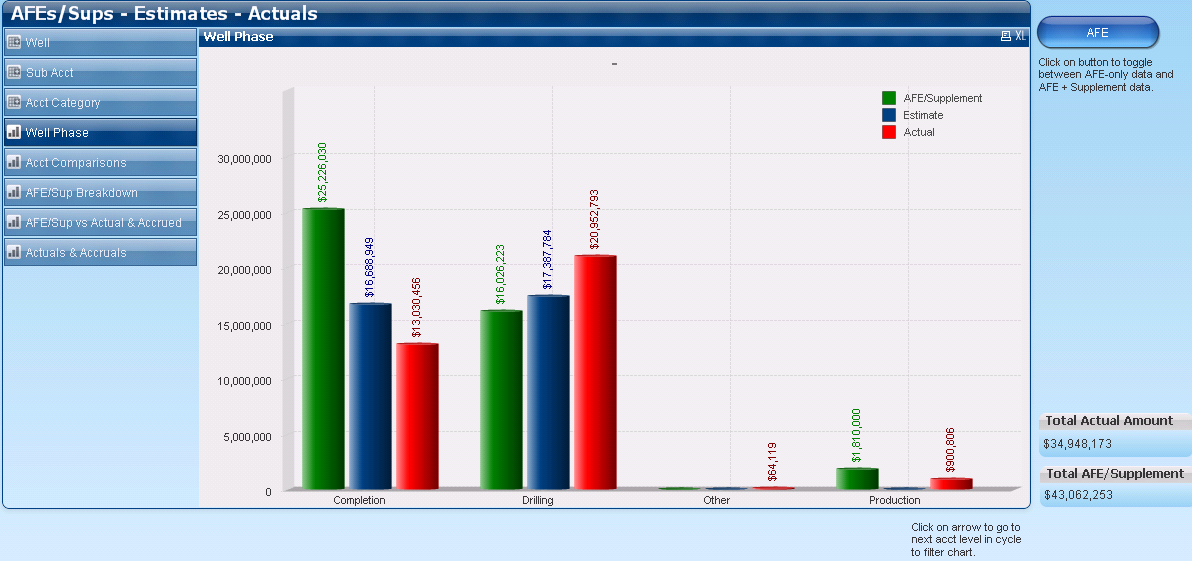
How do I show/hide text boxes and buttons based on which container box chart is selected/viewed? The button and the two Help text boxes should only be seen when an exec selects a certain tab (ie chart) to the left. For example, in the picture below, the Help text on the bottom should not be visible with this chart.
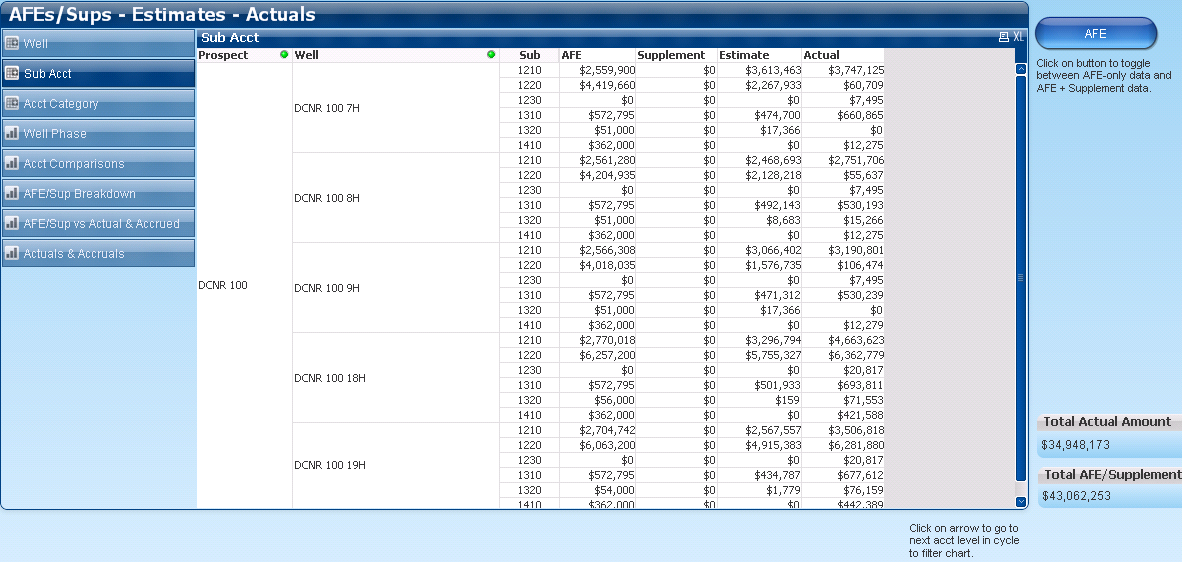
In this image, neither of the Help text boxes nor the button should be visible with this chart selected.
Accepted Solutions
- Mark as New
- Bookmark
- Subscribe
- Mute
- Subscribe to RSS Feed
- Permalink
- Report Inappropriate Content
Hi,
instead of the 8 charts to the left of the screen place 8 separate buttons with the same names as for the charts
& create 8 variables from var1 to var8.
Assign initial values to these variables as 0. Go to each button one by one and on Actions tab-->Add----->External--->Set Variable----> var1,Value=1
repeat it for the rest 7 buttons setting from var2 to var8
Now go to each chart named corresponding to button1---->Layout---->Show---->conditional---->var1=1
repeat for each chart. var2 to var8
You can do this for all related help text objects/buttons etc. by going to their layout tab
Now whenver u click on a particular button the related objects are shown.
Regards
- Mark as New
- Bookmark
- Subscribe
- Mute
- Subscribe to RSS Feed
- Permalink
- Report Inappropriate Content
Thanks for the help. Using the buttons worked and even made the presentation look better.
- Mark as New
- Bookmark
- Subscribe
- Mute
- Subscribe to RSS Feed
- Permalink
- Report Inappropriate Content
Thanks for the help. Using the buttons worked and even made the presentation look better.
- Mark as New
- Bookmark
- Subscribe
- Mute
- Subscribe to RSS Feed
- Permalink
- Report Inappropriate Content
Thanks for the help. Using the buttons worked and even made the presentation look better.
- Mark as New
- Bookmark
- Subscribe
- Mute
- Subscribe to RSS Feed
- Permalink
- Report Inappropriate Content
Thanks for the help. Using the buttons worked and even made the presentation look better.