Unlock a world of possibilities! Login now and discover the exclusive benefits awaiting you.
- Qlik Community
- :
- All Forums
- :
- QlikView App Dev
- :
- Occupancy rate
- Subscribe to RSS Feed
- Mark Topic as New
- Mark Topic as Read
- Float this Topic for Current User
- Bookmark
- Subscribe
- Mute
- Printer Friendly Page
- Mark as New
- Bookmark
- Subscribe
- Mute
- Subscribe to RSS Feed
- Permalink
- Report Inappropriate Content
Occupancy rate
Hello QVer,
I'm calculating occupancy rates of beds per day and then it is of interest to look over calendar weeks, months aso.
I'm showcasing two charts (straight table + bar chart):
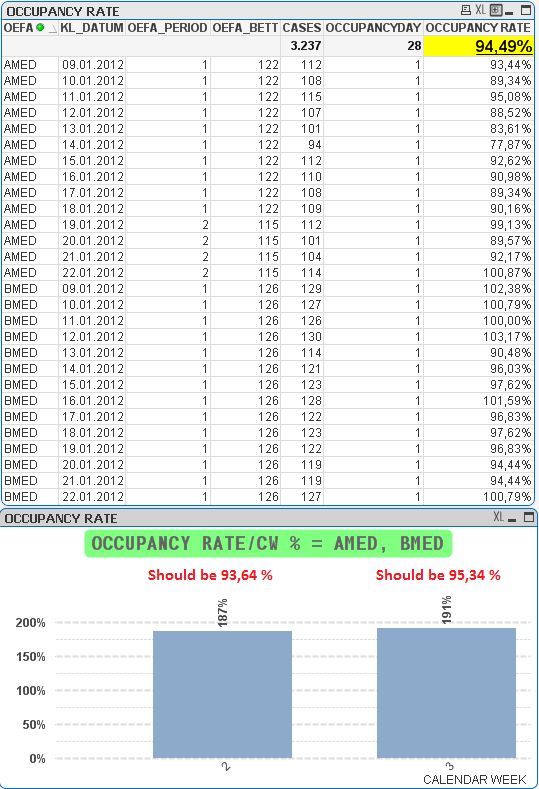
Selected are two OEFA (AMED + BMED) and the calendar week = 2+3 (equal to 28 occupancy days). The OEFA can have varying assigned beds over time.
I'm using the same formula in both charts to calculate the weighted occupancy rate:
=sum(CASES/OEFA_BETT)/count(distinct KL_DATUM)
Straight table shows the cumulated rate (94,49%) of 28 day corresponding to 2.+3. calendar week.
In bar chart I want to have the cumulated rates of selected OEFA per selected week(s) which is
2. week = 93,64% instead of the summation of 187%
3. week = 95,34% instead of the summation of 191%
In practice I'm using a set formula and I tried a lot.
Can someone help please? Thanks.
dj_skbs
Accepted Solutions
- Mark as New
- Bookmark
- Subscribe
- Mute
- Subscribe to RSS Feed
- Permalink
- Report Inappropriate Content
Hi
I think the problem is that OEFA is not a dimension in the bar chart. As far as I can see you have two records per day (one for AMED and one for BMED). To calculate the bar, you are dividing by distinct date, so for a week you would sum 14 records and diivide by 7, which results in 2x the correct amount which is what you are getting.
A quick workaround would be to update the expression for the chart to
=sum(CASES/OEFA_BETT) / count(distinct KL_DATUM) / count(distinct OEFA)
Hope that helps
Jonathan
- Mark as New
- Bookmark
- Subscribe
- Mute
- Subscribe to RSS Feed
- Permalink
- Report Inappropriate Content
hi
can you post your sample file ?
Regards,
Venkat
- Mark as New
- Bookmark
- Subscribe
- Mute
- Subscribe to RSS Feed
- Permalink
- Report Inappropriate Content
Hi
I think the problem is that OEFA is not a dimension in the bar chart. As far as I can see you have two records per day (one for AMED and one for BMED). To calculate the bar, you are dividing by distinct date, so for a week you would sum 14 records and diivide by 7, which results in 2x the correct amount which is what you are getting.
A quick workaround would be to update the expression for the chart to
=sum(CASES/OEFA_BETT) / count(distinct KL_DATUM) / count(distinct OEFA)
Hope that helps
Jonathan
- Mark as New
- Bookmark
- Subscribe
- Mute
- Subscribe to RSS Feed
- Permalink
- Report Inappropriate Content
You would probably also get the correct results if just removed the distinct from the count of KL_DATUM
Jonathan