Unlock a world of possibilities! Login now and discover the exclusive benefits awaiting you.
- Qlik Community
- :
- All Forums
- :
- QlikView App Dev
- :
- Dimension being ignored in Set Analysis with opera...
- Subscribe to RSS Feed
- Mark Topic as New
- Mark Topic as Read
- Float this Topic for Current User
- Bookmark
- Subscribe
- Mute
- Printer Friendly Page
- Mark as New
- Bookmark
- Subscribe
- Mute
- Subscribe to RSS Feed
- Permalink
- Report Inappropriate Content
Dimension being ignored in Set Analysis with operand
Hi Guys,
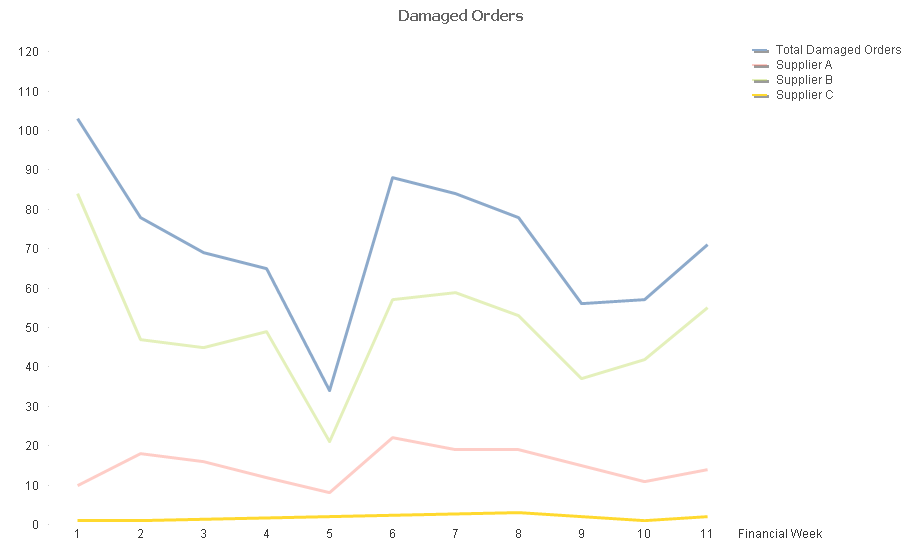
I have a set analysis expression which uses the union operand ("+") to identify unique Order Numbers that may be affected by errors from 2 areas.
Count({$<FOCGroupClass = {'Damaged'}>+<[Credit Reason] = {'Damaged Goods'}>}DISTINCT [Order Number])
We have a field called FOCGroupClass which indicates whether the Order was damaged, and similarly, we have a field called CreditReason which will also capture where an Order has been damaged. I need to count the unique Order numbers that have been affected which the above expression does very nicely within a table.
However, when i wish to use this in a chart with a week dimension and a year dimension, the Year dimension is being ignored.
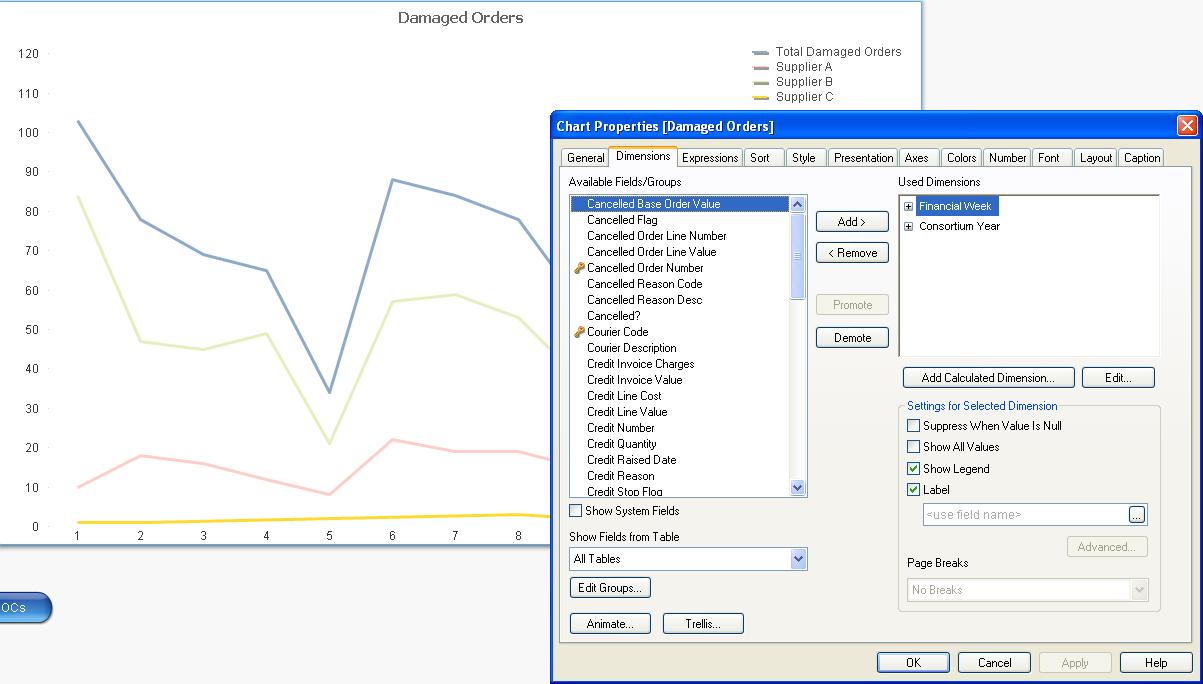
Is there another aspect that needs to be included in the Set Analysis to take this into consideration?
Hope this is clear, if not, i can attach the file.
Thanks,
Nick
Accepted Solutions
- Mark as New
- Bookmark
- Subscribe
- Mute
- Subscribe to RSS Feed
- Permalink
- Report Inappropriate Content
Yeah, a line chart is limited to two dimension + one expression or one dimension + any number of expressions. You could create more expressions for every year-supplier combination. But you might as well create that as a calculated dimension: supplier&'-'&year
talk is cheap, supply exceeds demand
- Mark as New
- Bookmark
- Subscribe
- Mute
- Subscribe to RSS Feed
- Permalink
- Report Inappropriate Content
Hi,
Can you attach the sample file.
Regards,
Jagan.
- Mark as New
- Bookmark
- Subscribe
- Mute
- Subscribe to RSS Feed
- Permalink
- Report Inappropriate Content
Not a problem,
Please find enclosed.
Thanks for your help
Nick
- Mark as New
- Bookmark
- Subscribe
- Mute
- Subscribe to RSS Feed
- Permalink
- Report Inappropriate Content
As far as I know you can use only one dimension in a line chart. There's only one x-axis after all. What do you expect to see in the chart?
talk is cheap, supply exceeds demand
- Mark as New
- Bookmark
- Subscribe
- Mute
- Subscribe to RSS Feed
- Permalink
- Report Inappropriate Content
I was hoping that it would create separate lines for each year such as;
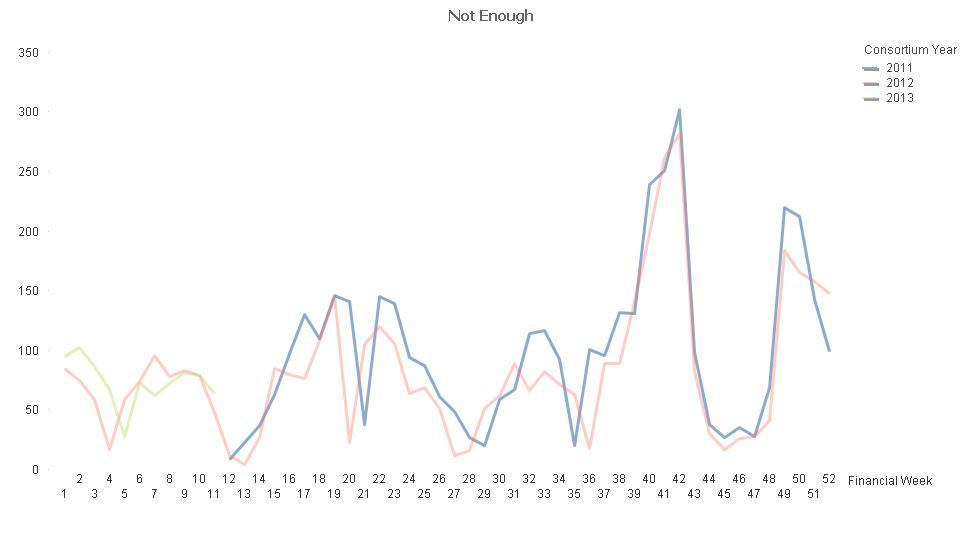
I'm assuming this doesn't happen since i have more than one expression in the other chart? Is there anyway i could create the above image with multiple expressions as well?
- Mark as New
- Bookmark
- Subscribe
- Mute
- Subscribe to RSS Feed
- Permalink
- Report Inappropriate Content
Yeah, a line chart is limited to two dimension + one expression or one dimension + any number of expressions. You could create more expressions for every year-supplier combination. But you might as well create that as a calculated dimension: supplier&'-'&year
talk is cheap, supply exceeds demand
- Mark as New
- Bookmark
- Subscribe
- Mute
- Subscribe to RSS Feed
- Permalink
- Report Inappropriate Content
check the sample this might be you expected
- Mark as New
- Bookmark
- Subscribe
- Mute
- Subscribe to RSS Feed
- Permalink
- Report Inappropriate Content
Thanks Sivaraj but that then hides the split by Supplier.
I have taken Gysbert's advice and have built an expression for each year.
Thanks everybody for their help.
Nick