Unlock a world of possibilities! Login now and discover the exclusive benefits awaiting you.
- Qlik Community
- :
- All Forums
- :
- QlikView App Dev
- :
- linest_m trendline correct value?
- Subscribe to RSS Feed
- Mark Topic as New
- Mark Topic as Read
- Float this Topic for Current User
- Bookmark
- Subscribe
- Mute
- Printer Friendly Page
- Mark as New
- Bookmark
- Subscribe
- Mute
- Subscribe to RSS Feed
- Permalink
- Report Inappropriate Content
linest_m trendline correct value?
Hi!
I have a chart (below) that shows Revenue over recent Weeks... In my chart I have added the trendline.
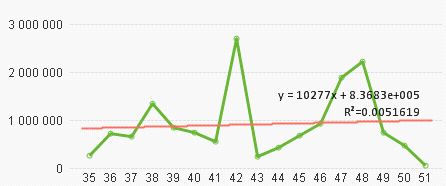
I want to use the calculate the slope and found the linest_m function, my expression is like this: LINEST_M(Revenue, Week)
But the result of my expression showed: -738,47539
Shouldn't the result be a positive value, as the trend is positive? What am I doing wrong?
Thanks in advance!
Best regards,
Filip
- Mark as New
- Bookmark
- Subscribe
- Mute
- Subscribe to RSS Feed
- Permalink
- Report Inappropriate Content
Yes, you would probably expect a positive value. But it's hard to say what's causing the difference just by looking at the image.
Could you post a small sample app (or the data you are using as Excel or INLINE LOAD table)?
- Mark as New
- Bookmark
- Subscribe
- Mute
- Subscribe to RSS Feed
- Permalink
- Report Inappropriate Content
This is other numbers, but still the value gets wrong when counting on a conditional trendline... Please see my attached example.
Best,
Filip
- Mark as New
- Bookmark
- Subscribe
- Mute
- Subscribe to RSS Feed
- Permalink
- Report Inappropriate Content
Filip,
the value that linest_m returns seems correct to me (you can check this by calculating the slope with Excel, for example).
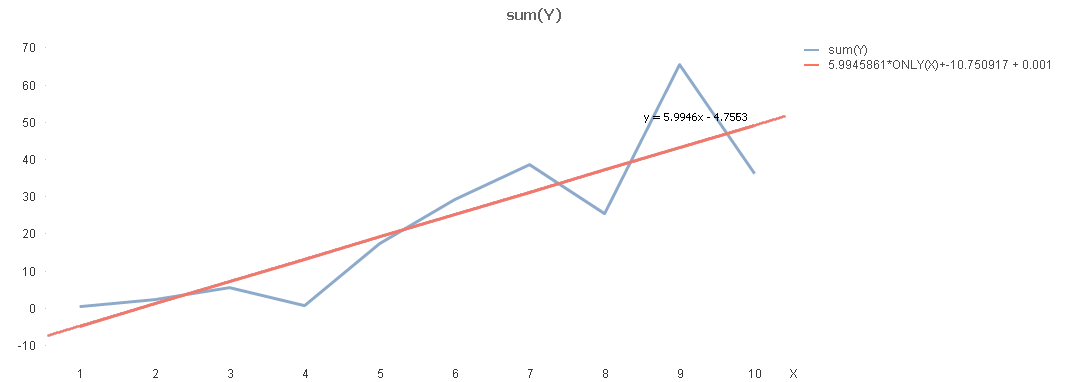
I think the equation that the linear regression option in chart properties will show is terribly wrong. It seems to me that QV is not taking the different x-step sizes correctly into account when calculating the lienar regression. In fact, if you change the axis to continuous in axes tab,the x-step sizes are shown correct, and the produced linear regression, too.
(Tested in QV 11.20.11643.0 IR)
IMO, you can and should report this as bug to QT support.
Regards,
Stefan
- Mark as New
- Bookmark
- Subscribe
- Mute
- Subscribe to RSS Feed
- Permalink
- Report Inappropriate Content
OK, I can agree that QV may not calculate properly when there are differences on the x axis.
Please take a look at my attached qv-document. I still can't understand if I am doing something wrong when fetching the Trend Value.
What I want to do is visualize the trend with a text 'Positive'/'Negative'... But I can't find my simple calculations reliable as the value even gets negative with a clear positive trend in the chart.
Thanks for your help.
Best regards,
Filip
- Mark as New
- Bookmark
- Subscribe
- Mute
- Subscribe to RSS Feed
- Permalink
- Report Inappropriate Content
Filip,
one big difference between your charts and the linest_m expression is the fact that you aggregate your revenue values in the line chart, but not in the linest_m function (and since your data shows multiple records per week, even for the same flag, that's a big difference).
You can modify your linest_m function to:
=LINEST_M(aggr(sum(Revenue), Week),aggr(Week,Week))
to produce the same result as your chart (considering the additional bug with non continuous x-axis values as discussed before).
See also attached.
Regards,
Stefan
- Mark as New
- Bookmark
- Subscribe
- Mute
- Subscribe to RSS Feed
- Permalink
- Report Inappropriate Content
I´ve just noticed similar behaviour here.
The "show equation" of feature trendline seems to be buggy
I´ve created a very, very example.
LINEST_M seems to be ok with the plotted equation
LINEST_B is totally different.
I´ve included an expression into the line graph with linest_m and linest_b and the lines are ok (my line and trendline) but the "b" value for the equation is not ok