Unlock a world of possibilities! Login now and discover the exclusive benefits awaiting you.
- Qlik Community
- :
- All Forums
- :
- QlikView App Dev
- :
- Grouping fields
- Subscribe to RSS Feed
- Mark Topic as New
- Mark Topic as Read
- Float this Topic for Current User
- Bookmark
- Subscribe
- Mute
- Printer Friendly Page
- Mark as New
- Bookmark
- Subscribe
- Mute
- Subscribe to RSS Feed
- Permalink
- Report Inappropriate Content
Grouping fields
Hi,
How i can group field interactive on document not from edit script.
if i need to select all fields then depends on what i need i can create document that group field and give me sum(balances).
Ex:.
Branch,Account,suffix ,Currency ,Balance
1,xxxx,001,USD,100
1,xxxx,002,USD,200
1,xxxx,004,EUR,100
1,xxxx,005,EUR,200
1,xxxx,006,EUR,200
then i need to show him as follow:
Branch,Account,Currency, sum(balance)
1,xxxx,USD,300
1,xxxx,EUR,500
Thanks
- Mark as New
- Bookmark
- Subscribe
- Mute
- Subscribe to RSS Feed
- Permalink
- Report Inappropriate Content
What is meant by Interactive in document?
If you are looking for conditional dimensions? -- See attached.
- Mark as New
- Bookmark
- Subscribe
- Mute
- Subscribe to RSS Feed
- Permalink
- Report Inappropriate Content
Interactive document mean that i can group , un-group fields from documents option not to go to script
and change SQL.
i can not access attached;becuase may i installed personel edition
Thanks
- Mark as New
- Bookmark
- Subscribe
- Mute
- Subscribe to RSS Feed
- Permalink
- Report Inappropriate Content
You may create a pivot table chart with Currency, Branch, Account, suffix as Dimensions and Sum(Balance) as Expresion. You can specify partial totals at the required fields to get what you want.
- Mark as New
- Bookmark
- Subscribe
- Mute
- Subscribe to RSS Feed
- Permalink
- Report Inappropriate Content
That would be easy....there are two options
Option 1: //Works in version QV 11 onwards
Report Builder
Since you cant open the atached, follow below steps...
Script: copy this into your script
Data:
load * inline [
Branch,Account,suffix ,Currency ,Balance
1,xxxx,001,USD,100
1,xxxx,002,USD,200
1,xxxx,004,EUR,100
1,xxxx,005,EUR,200
1,xxxx,006,EUR,200
];
//This is just a inlne table to hide and display the dimensions in the chart..
Dims:
Load * Inline [
Dims
Branch
Account
suffix
Currency];
Front end:
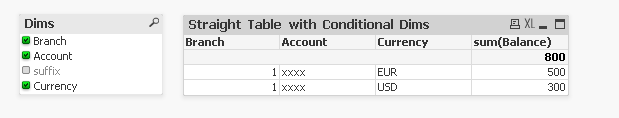
1. Add "Dims" as list box.
2. Create a chart and add all the available dimensions from the data table.
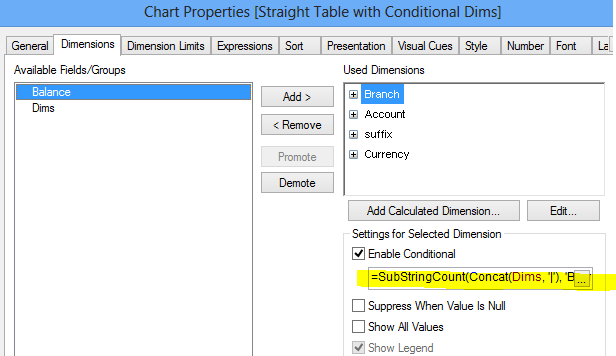
3. On each dimension add the conditional statemets to show or hide the Dims.
a. for Branch = SubStringCount(Concat(Dims, '|'), 'Branch')
b. for Account =SubStringCount(Concat(Dims, '|'), 'Account')...and so on
4. Add the expresssion sum(Balance)
5. Try choosing Dims from the list box...Woola you have a Sum(Balance) grouped by the dimensions you choose...no need to go back to the script..
Option 1: //Works in any QV version
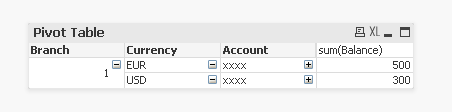
Pivot Table
As Mooorthy Said below...you can use a Pivot table..
Just add all the dimensions and expressions you need to the Pivot table.
Pivot table allows you to "expand" and collapse the dimensions...
Hope you will solve your problem...
Phani
- Mark as New
- Bookmark
- Subscribe
- Mute
- Subscribe to RSS Feed
- Permalink
- Report Inappropriate Content
Thanks All.
That what i need.
- Mark as New
- Bookmark
- Subscribe
- Mute
- Subscribe to RSS Feed
- Permalink
- Report Inappropriate Content
You are welcome !!!
And mark this Thread as answered..so that Community people can easly find the Answer for the similar questions...!!!