Unlock a world of possibilities! Login now and discover the exclusive benefits awaiting you.
- Qlik Community
- :
- All Forums
- :
- QlikView App Dev
- :
- Bar Chart less ,greater than a level
Options
- Subscribe to RSS Feed
- Mark Topic as New
- Mark Topic as Read
- Float this Topic for Current User
- Bookmark
- Subscribe
- Mute
- Printer Friendly Page
Turn on suggestions
Auto-suggest helps you quickly narrow down your search results by suggesting possible matches as you type.
Showing results for
Not applicable
2013-05-12
11:06 PM
- Mark as New
- Bookmark
- Subscribe
- Mute
- Subscribe to RSS Feed
- Permalink
- Report Inappropriate Content
Bar Chart less ,greater than a level
Hi,
sorry about my pool english.
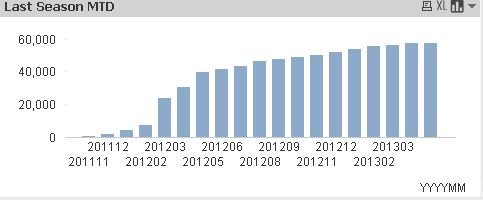
I want to build a barchart like that:
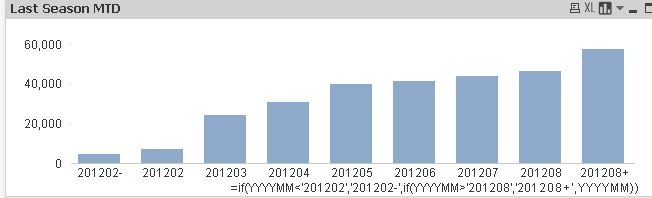
less than a level show a total, greater than a level show a total ,and others are normal.
example:
The normal range :201203-201308
below 201203, i want to show a total in chart
above 201308,i want to show a total in chart.
Effect like that:
can anyone hep me?
Best Regards,
HarryLiu
382 Views
2 Replies
Master II
2013-05-13
12:37 AM
- Mark as New
- Bookmark
- Subscribe
- Mute
- Subscribe to RSS Feed
- Permalink
- Report Inappropriate Content
Hi,
If you are using QV-11 then you can try to check the dimensional limit tab in the chart property.
if you are not using QV-11 then share the sample application for the resolution.
HTH
Sushil
181 Views
Not applicable
2013-05-13
02:00 AM
Author
- Mark as New
- Bookmark
- Subscribe
- Mute
- Subscribe to RSS Feed
- Permalink
- Report Inappropriate Content
HI Sushil,
Thanks for your reply.
I'm using QV-11. But the dimension limits tab can only show part of the data.
I want show all data ,just head show less than parts and end show greater parts.
The data like that:
| YYYYMM | Quantity |
|---|---|
| 201111 | 116 |
| 201112 | 1620 |
| 201201 | 4448 |
| 201202 | 7025 |
| 201203 | 23904 |
| 201204 | 30581 |
| 201205 | 39777 |
| 201206 | 41211 |
| 201207 | 43504 |
| 201208 | 46497 |
| 201209 | 47475 |
| 201210 | 48765 |
| 201211 | 49804 |
| 201212 | 51682 |
| 201301 | 53405 |
| 201302 | 55239 |
| 201303 | 56220 |
| 201304 | 57087 |
| 201305 | 57881 |
181 Views