Unlock a world of possibilities! Login now and discover the exclusive benefits awaiting you.
- Qlik Community
- :
- All Forums
- :
- QlikView App Dev
- :
- Changing symbol for specific value
- Subscribe to RSS Feed
- Mark Topic as New
- Mark Topic as Read
- Float this Topic for Current User
- Bookmark
- Subscribe
- Mute
- Printer Friendly Page
- Mark as New
- Bookmark
- Subscribe
- Mute
- Subscribe to RSS Feed
- Permalink
- Report Inappropriate Content
Changing symbol for specific value
Hi,
I have a line chart (with symbols), and what I'm looking for is differentiating a point on the graph if the value is a specific value (i.e. under 50). I see either 2 options:
1. I change the symbol altogether to something specific
2. I change the color of the symbol to a specific color like black.
Here's an image of what I'm looking at:
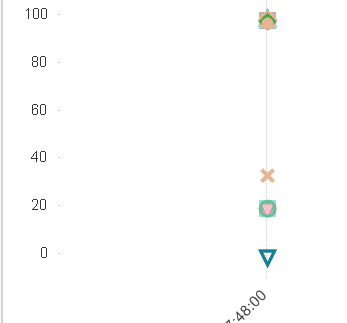
Any help is appreciated.
- Mark as New
- Bookmark
- Subscribe
- Mute
- Subscribe to RSS Feed
- Permalink
- Report Inappropriate Content
The only way I could think of to create multiple symbols off the same expression value is actually to separate the expressions! Not a great solution but I think it works:
Example:
Let's say you have Sum(Sales) as your current expression, this allows you to configure only one symbol type.
Let's assume like above that you want a trianlge at 0-20, square at 21-30, cross at 31-50 and diamond at 51+, this being the case you could now create 4 expressions as follows:
1. IF(Sum(Sales)<=20,Sum(Sales)) symbol type = tirangle
2. IF(Sum(Sales)>20 AND Sum(Sales)<=30,Sum(Sales) symbol type = square
etc, etc
- Mark as New
- Bookmark
- Subscribe
- Mute
- Subscribe to RSS Feed
- Permalink
- Report Inappropriate Content
Hi,
When I have more than one expression, the chart fails to show all the data points. On another line graph, I simply set the background color definition to something like:
IF(only(VALUE)<0, black(), red())
and this works well. But in this case, I get an error saying "Drawing of chart failed internally".
- Mark as New
- Bookmark
- Subscribe
- Mute
- Subscribe to RSS Feed
- Permalink
- Report Inappropriate Content
The error seems to result in the following scenario
1. Line Chart
2. Two dimensions
3. Two expressions
4. First expression is set to 'text as popup' only (no line or symbols) ... this is to show an extra data point in the pop-up
5. Second expression is set to 'symbols' only.
6. Second expression has a conditional expression on the background color property to conditionally show a color based on the expression.
-> ERROR
The trick was to go to the presentation tab and uncheck 'show legend'.
Charting engine is getting confused on what symbol/color combination to show in the legend when it could be two different colors depending on the background color expression value.
- Mark as New
- Bookmark
- Subscribe
- Mute
- Subscribe to RSS Feed
- Permalink
- Report Inappropriate Content
Hi
Let say you are using a grap with one one expression, for example sum(Sales)
You should try this:
1) Edit your chart and go to tab expression
2) Copy the expression (sum(Sales)) that your are using
2) Click on the '+' of your expression
4) Then double click on Line Style in order to get the Edit expression window.
5) Write the following code
=if(sum(Sales)<50,'S2','S3')
Some explanations:
'S2' gives you dashed symbol, 'S3' gives you dotted symbol
From the Qlikview manual reference:
The style of the line can be controlled by including a tag <Sn>
where n is an integer between 1 and 4 indicating the style to
be used (1=continous, 2= dashed, 3=dotted, 4=dashed/dotted)
6) It's should be ok
Best regards,
Antoine
- Mark as New
- Bookmark
- Subscribe
- Mute
- Subscribe to RSS Feed
- Permalink
- Report Inappropriate Content
I had this issue, except I found that setting width and style in line style on the second expression caused the "Drawing of chart failed internally".
Unchecking legend caused the error to go away. I need the legend however.
Moving the expression up to be the first one, not the second, also caused the error to go away.
That is what I will do - unfortunately the first expression also does not work properly in the second position for a different reason. Will see if I can resolve that.