Unlock a world of possibilities! Login now and discover the exclusive benefits awaiting you.
- Qlik Community
- :
- All Forums
- :
- QlikView App Dev
- :
- Conditional count of changes
- Subscribe to RSS Feed
- Mark Topic as New
- Mark Topic as Read
- Float this Topic for Current User
- Bookmark
- Subscribe
- Mute
- Printer Friendly Page
- Mark as New
- Bookmark
- Subscribe
- Mute
- Subscribe to RSS Feed
- Permalink
- Report Inappropriate Content
Conditional count of changes
Hi all,
While constructing a application I encountered a issue for which I have created the following example:
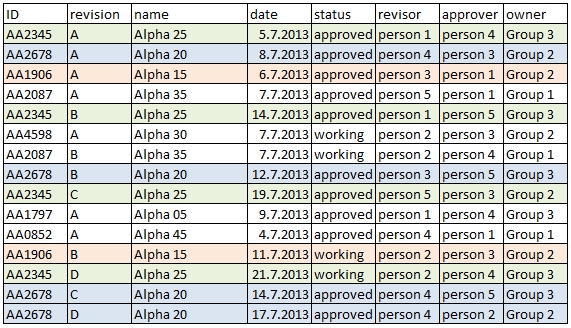
Note: Excel file is attached
Following rules apply:
-date revision > date existing ID
-Valid revision is a increase higher than A of revision for a ID
-Revisor and approver may never be the same
Target:
Count of increase of revisions higher than A per ID where the status is approved and express the outcome per owner.
Expected outcome:
Group 1=0 AA2087 revision B is working: therefore no count)
Group 2=3 (counted: AA2678 A to B, B to C, C to D)
Group 3=2 (counted: AA2345 A to B, B to C)
I want to display these values in a chart/table.
I am not an experienced with Qlikview. I hope you will be able to help me getting into the right direction.
Thanks in advance!
Regards,
Johan