Unlock a world of possibilities! Login now and discover the exclusive benefits awaiting you.
- Qlik Community
- :
- All Forums
- :
- QlikView App Dev
- :
- How get second expression displayed correctly acco...
- Subscribe to RSS Feed
- Mark Topic as New
- Mark Topic as Read
- Float this Topic for Current User
- Bookmark
- Subscribe
- Mute
- Printer Friendly Page
- Mark as New
- Bookmark
- Subscribe
- Mute
- Subscribe to RSS Feed
- Permalink
- Report Inappropriate Content
How get second expression displayed correctly according to dimensions
Hi,
I have a problem with a chart when using two expressions and two dimensions. I want to compare how many patients that visited our ER 2012 and 2013 month by month. So far so good. Then I want to add an expression that counts how many of the patients that have a certain property A. I want the total number of patients displayed with bars and the number that have property A to be displayed with a symbol. See below.
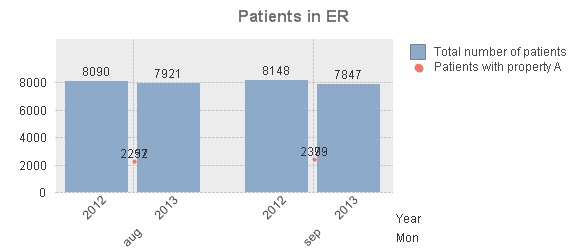
The problem is that the second expression (prop A) is displayed with the values on top of each other which makes them impossible to read. How do I get the second expression displayed according to the year dimension like the first expression (total) is?
Using QV 10 SR 6.
/Sara