Unlock a world of possibilities! Login now and discover the exclusive benefits awaiting you.
- Qlik Community
- :
- All Forums
- :
- QlikView App Dev
- :
- Font Changes
- Subscribe to RSS Feed
- Mark Topic as New
- Mark Topic as Read
- Float this Topic for Current User
- Bookmark
- Subscribe
- Mute
- Printer Friendly Page
- Mark as New
- Bookmark
- Subscribe
- Mute
- Subscribe to RSS Feed
- Permalink
- Report Inappropriate Content
Font Changes
Hi,
I have a request from a user to change the Font size, Color and also want to make it Bold.
Attached chart object where the count has been highlighted needs the changes as discussed above.
Thanks,
H
Accepted Solutions
- Mark as New
- Bookmark
- Subscribe
- Mute
- Subscribe to RSS Feed
- Permalink
- Report Inappropriate Content
You can do it using attribute expressions.
On the Expressions tab, click the "+" sign at your expression name. Select "Text Color". In definition, type expression for color, e.g. rgb(255,0,0) for red.
Next, select "Text Format". Expression definition will be '<b>' to make it bold.
Regards,
Michael
- Mark as New
- Bookmark
- Subscribe
- Mute
- Subscribe to RSS Feed
- Permalink
- Report Inappropriate Content
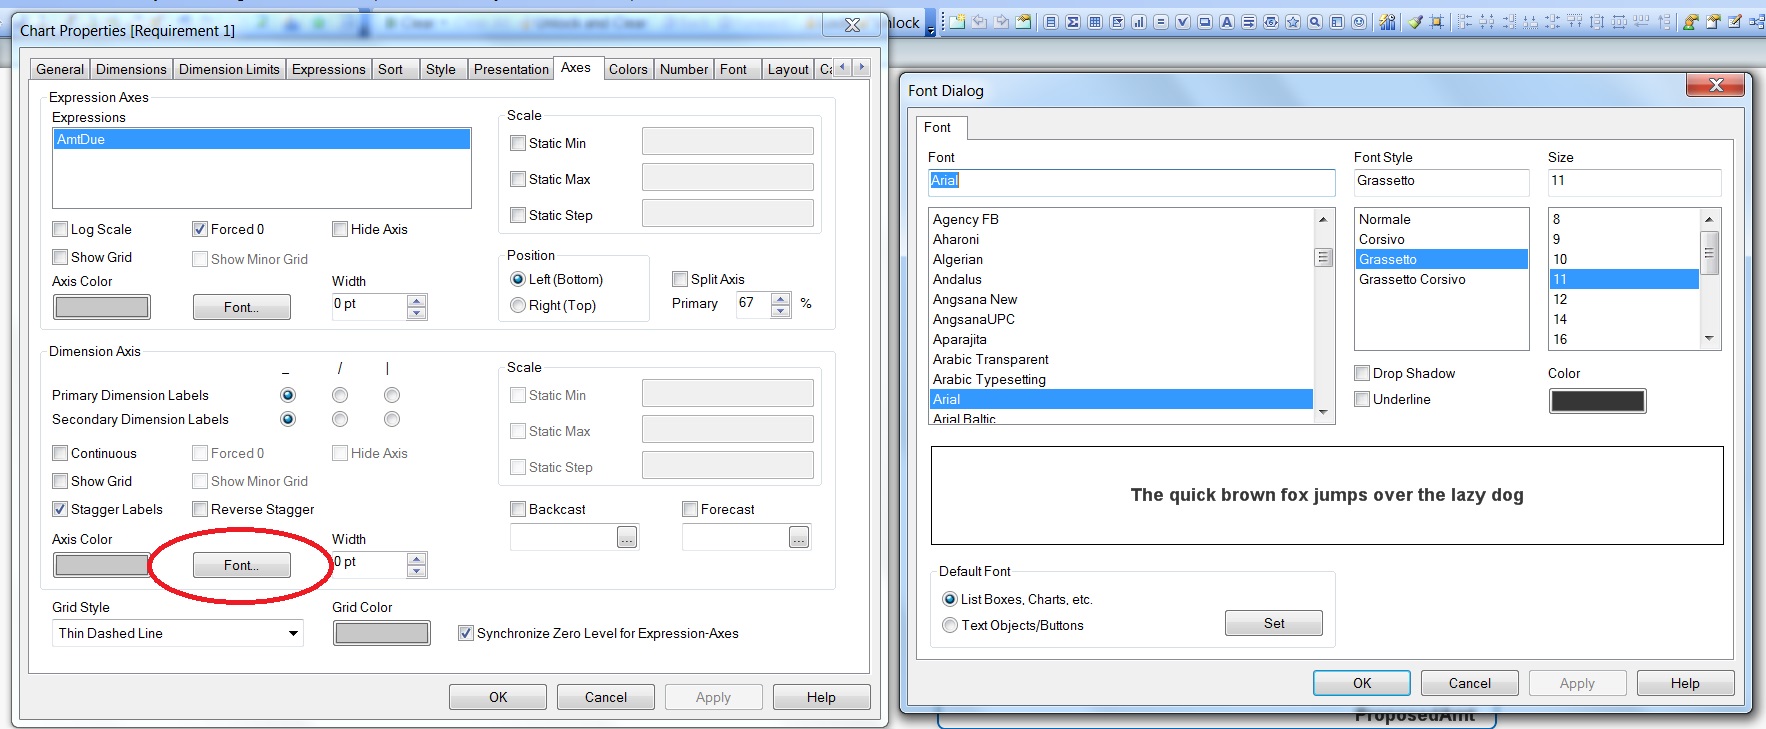
If you're using the Text on Axis option you can change the color using the Axis Color button in the Dimension Axis part of the Axes tab of the charts properties window. I don't think you can change the font size and style.
talk is cheap, supply exceeds demand
- Mark as New
- Bookmark
- Subscribe
- Mute
- Subscribe to RSS Feed
- Permalink
- Report Inappropriate Content
Try to change axis font...
Look at the screenshot
Mario
- Mark as New
- Bookmark
- Subscribe
- Mute
- Subscribe to RSS Feed
- Permalink
- Report Inappropriate Content
You can do it using attribute expressions.
On the Expressions tab, click the "+" sign at your expression name. Select "Text Color". In definition, type expression for color, e.g. rgb(255,0,0) for red.
Next, select "Text Format". Expression definition will be '<b>' to make it bold.
Regards,
Michael
- Mark as New
- Bookmark
- Subscribe
- Mute
- Subscribe to RSS Feed
- Permalink
- Report Inappropriate Content
Gysbert Wassenaar, mariocarmine
From the screenshot, it looks like "text on Axis", hence can be modified by attribute expressions.
If it is the Dimension values on Axis, than you're right and I'm not.
Regards,
Michael
- Mark as New
- Bookmark
- Subscribe
- Mute
- Subscribe to RSS Feed
- Permalink
- Report Inappropriate Content
Thank you all but the count is visible because of selection : Text on Axis. So even if I make font changes it is not reflecting. as shown in the image below(attached)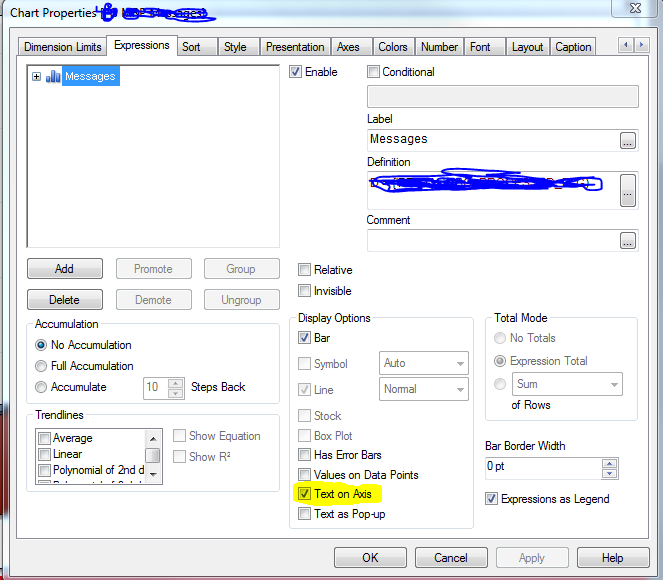
- Mark as New
- Bookmark
- Subscribe
- Mute
- Subscribe to RSS Feed
- Permalink
- Report Inappropriate Content
