Unlock a world of possibilities! Login now and discover the exclusive benefits awaiting you.
- Qlik Community
- :
- All Forums
- :
- QlikView App Dev
- :
- bar chart sum last year total
- Subscribe to RSS Feed
- Mark Topic as New
- Mark Topic as Read
- Float this Topic for Current User
- Bookmark
- Subscribe
- Mute
- Printer Friendly Page
- Mark as New
- Bookmark
- Subscribe
- Mute
- Subscribe to RSS Feed
- Permalink
- Report Inappropriate Content
bar chart sum last year total
hi all,
bar chart sum last year total
sum( {$<Year={"<=$(Year)-1"}>} value)
Dimensions : if(MonthYear >= '012013',MonthYear)
bar chart value :
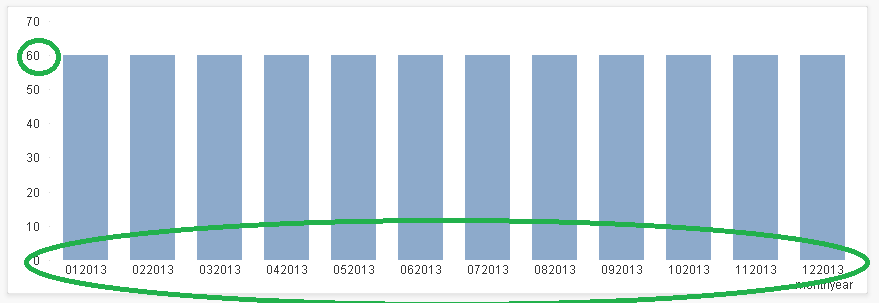
012013 > 60
022013 > 60
032013 > 60
042013 > 60
052013 > 60
062013 > 60
072013 > 60
082013 > 60
092013 > 60
102013 > 60
112013 > 60
122013 > 60
- Tags:
- qlikview_scripting
- « Previous Replies
-
- 1
- 2
- Next Replies »
- Mark as New
- Bookmark
- Subscribe
- Mute
- Subscribe to RSS Feed
- Permalink
- Report Inappropriate Content
try
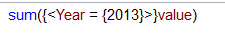
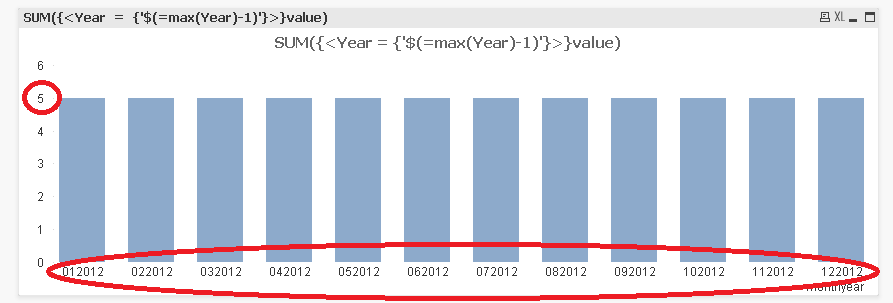
SUM({<Year = {'$(=max(Year)-1)'}>}value)
Regards
Al
- Mark as New
- Bookmark
- Subscribe
- Mute
- Subscribe to RSS Feed
- Permalink
- Report Inappropriate Content
or you could try
- Mark as New
- Bookmark
- Subscribe
- Mute
- Subscribe to RSS Feed
- Permalink
- Report Inappropriate Content
Hi Alan,
expression you sent ; SUM({<Year = {'$(=max(Year)-1)'}>}value)
should be ;
- Mark as New
- Bookmark
- Subscribe
- Mute
- Subscribe to RSS Feed
- Permalink
- Report Inappropriate Content
Hi Alan,
expression you sent ; SUM({<Year = {'$(=max(Year)-1)'}>}value)

should be ;

- Mark as New
- Bookmark
- Subscribe
- Mute
- Subscribe to RSS Feed
- Permalink
- Report Inappropriate Content
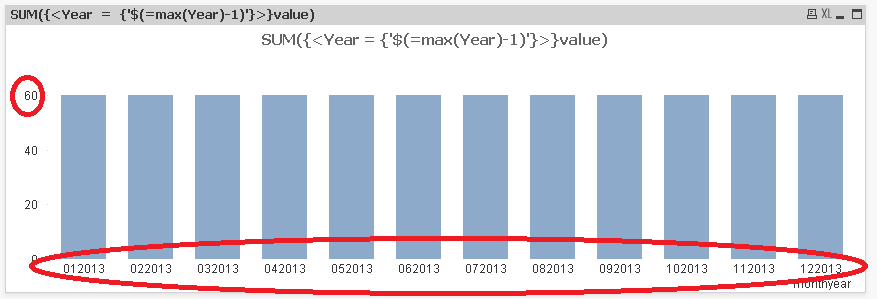
so should it be
SUM({<Year = {'$(=max(Year))'}>}value)
which will give

- Mark as New
- Bookmark
- Subscribe
- Mute
- Subscribe to RSS Feed
- Permalink
- Report Inappropriate Content
should be ;
I want to be like
example : 012013 value >> 2012 vales total 60
012013 > 60
022013 > 60
032013 > 60
042013 > 60
052013 > 60
062013 > 60
072013 > 60
082013 > 60
092013 > 60
102013 > 60
112013 > 60
122013 > 60
- Mark as New
- Bookmark
- Subscribe
- Mute
- Subscribe to RSS Feed
- Permalink
- Report Inappropriate Content
so add TOTAL, something like

- Mark as New
- Bookmark
- Subscribe
- Mute
- Subscribe to RSS Feed
- Permalink
- Report Inappropriate Content
Thanks Alan,
There is a more problem with,
Year to day total
how can ?
example : bar chart Dimensions >> montyear 08-2013
< 08-2013 + > 01-2013
value YTD total > 80+70+60+50+40+30+20+10 = 360
example : bar chart Dimensions >> montyear 07-2013
value YTD total > 70+60+50+40+30+20+10 = 280
- Mark as New
- Bookmark
- Subscribe
- Mute
- Subscribe to RSS Feed
- Permalink
- Report Inappropriate Content
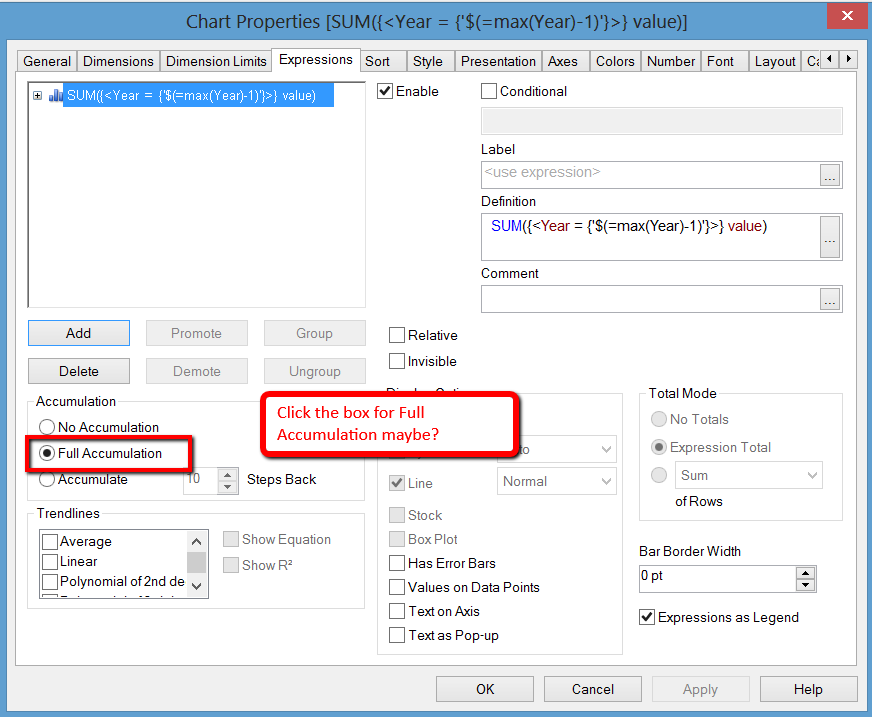
Hi,
See below, maybe this could get the result you need
- « Previous Replies
-
- 1
- 2
- Next Replies »