Unlock a world of possibilities! Login now and discover the exclusive benefits awaiting you.
- Qlik Community
- :
- All Forums
- :
- QlikView App Dev
- :
- Set Analysis help request
- Subscribe to RSS Feed
- Mark Topic as New
- Mark Topic as Read
- Float this Topic for Current User
- Bookmark
- Subscribe
- Mute
- Printer Friendly Page
- Mark as New
- Bookmark
- Subscribe
- Mute
- Subscribe to RSS Feed
- Permalink
- Report Inappropriate Content
Set Analysis help request

Above is a chart set up the way the client wants to view the data. If I try =SUM(Percent) it returns the total for every row of data. I have tried MIN(Percent) and it gives the minimum for that project I have tried various other set analyses like =SUM({1}Percentage) and have had no luck. 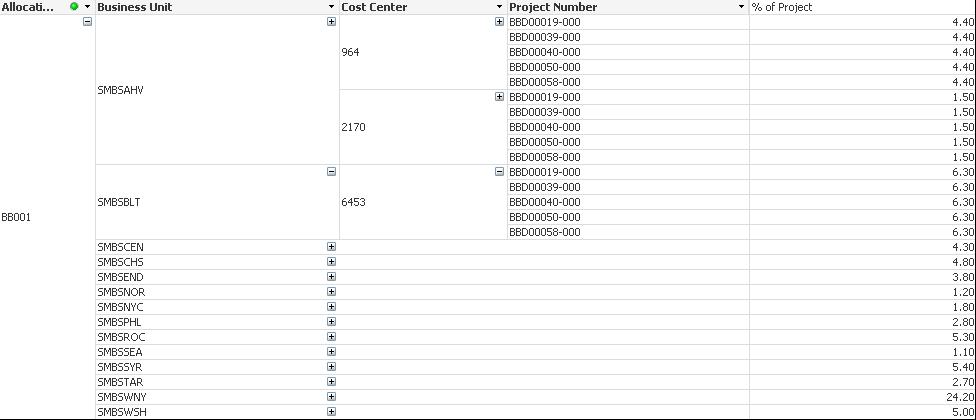
I have a picture of what I am trying to do. Each Cost center has it’s own percentage. This percentage is repeated over multiple projects. I need to add up the percentages by allocation code. The percentages never change but are repeated in the data. So Cost Center X will always have a percentage of Y in Allocation code Z. How can I return the total of distinct cost center percentages by allocation code using set analysis?
Thanks in advance,
Frank