Unlock a world of possibilities! Login now and discover the exclusive benefits awaiting you.
- Qlik Community
- :
- Forums
- :
- Analytics
- :
- App Development
- :
- Line chart filter entire line based on end value
- Subscribe to RSS Feed
- Mark Topic as New
- Mark Topic as Read
- Float this Topic for Current User
- Bookmark
- Subscribe
- Mute
- Printer Friendly Page
- Mark as New
- Bookmark
- Subscribe
- Mute
- Subscribe to RSS Feed
- Permalink
- Report Inappropriate Content
Line chart filter entire line based on end value
Hello everyone!
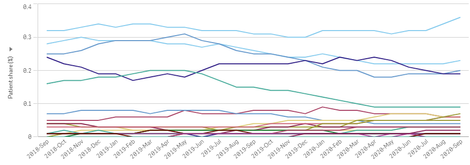
I am developing an app on Market share data for certain drugs and I have a line chart showing the Market Share evolution over time for each drug (each line represents a drug), as below
The request from the users of the application is to be able to hide the drugs that have a market share lower than a specific threshold (let's assume 2%) in the last period of the analysis. Ideally, the users should be able to change the threshold in the app with a slider.
I was able to calculate the share for the last period: Sum({<End_Date={"$(=Date(Last_Update,'DD/MM/YYYY'))"}>} value) but when I try to insert conditions on the last period share, then chart filters automatically on the last period only.
any ideas on how I could filter the entire line when the condition 'End period market share <= x%' is met?
- Tags:
- line chart
