Unlock a world of possibilities! Login now and discover the exclusive benefits awaiting you.
- Qlik Community
- :
- All Forums
- :
- Integration, Extension & APIs
- :
- Fast change Dimension or measure on button selecti...
- Subscribe to RSS Feed
- Mark Topic as New
- Mark Topic as Read
- Float this Topic for Current User
- Bookmark
- Subscribe
- Mute
- Printer Friendly Page
- Mark as New
- Bookmark
- Subscribe
- Mute
- Subscribe to RSS Feed
- Permalink
- Report Inappropriate Content
Fast change Dimension or measure on button selection
Hi ,
I want to change graph on button selection in Qlik Sense. Graph or chart expression will change, user click on Button Sales or Quantity . for this I have used extension.
it shows last measure (qty) by default. not changing on button click. Helpful solution was shared by Andy. click on this thread >Makes Sense to go round in circles
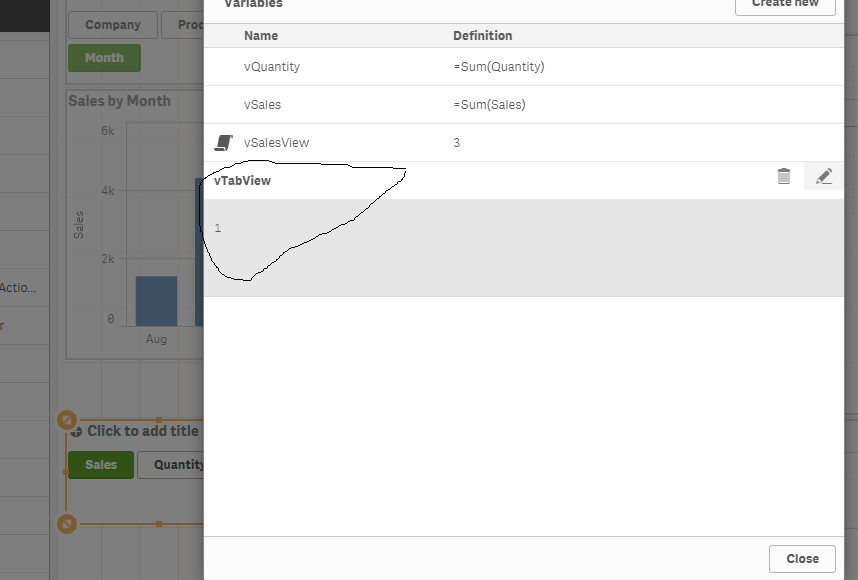
if I pass 1 inside variable, this shows sales and neither button click work nor show quantity


Regards
Ajeet
- Mark as New
- Bookmark
- Subscribe
- Mute
- Subscribe to RSS Feed
- Permalink
- Report Inappropriate Content
have you tried $ expansion with vTabview?
$(vTabview)
If a post helps to resolve your issue, please accept it as a Solution.
- Mark as New
- Bookmark
- Subscribe
- Mute
- Subscribe to RSS Feed
- Permalink
- Report Inappropriate Content
Hi Ajeet
How about convert the table to bar chart. see the attachment,
- Mark as New
- Bookmark
- Subscribe
- Mute
- Subscribe to RSS Feed
- Permalink
- Report Inappropriate Content
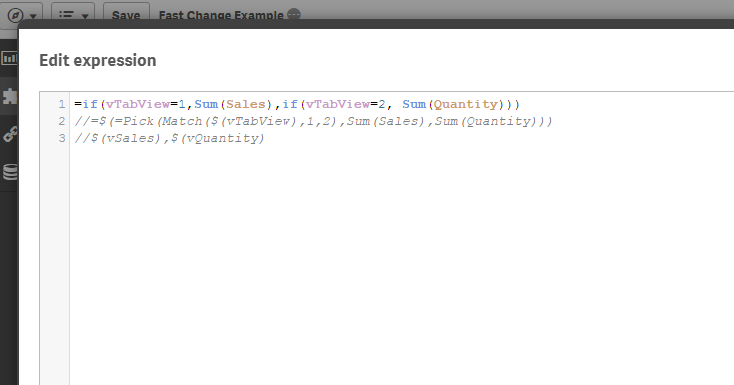
yes, I am using below expression in Measure.
=if($(vTabView)=1,Sum(Sales), Sum(Quantity))
//=$(=Pick(Match($(vTabView),1,2),Sum(Sales),Sum(Quantity)))
//$(vSales),$(vQuantity)
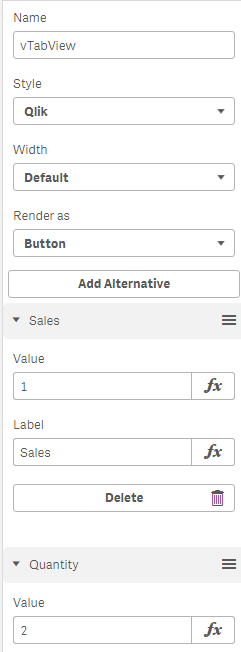
and below is screenshot of setting up variable button..

Regards
Ajeet
- Mark as New
- Bookmark
- Subscribe
- Mute
- Subscribe to RSS Feed
- Permalink
- Report Inappropriate Content
no sir, this is not relevant to my discussion. Let me hear suggestion like Vineeth.
Regards
Ajeet