Unlock a world of possibilities! Login now and discover the exclusive benefits awaiting you.
- Qlik Community
- :
- Support
- :
- Support
- :
- Knowledge
- :
- Member Articles
- :
- Color Themes with ColorMix.qvf
- Edit Document
- Move Document
- Delete Document
- Subscribe to RSS Feed
- Mark as New
- Mark as Read
- Bookmark
- Subscribe
- Printer Friendly Page
- Report Inappropriate Content
Color Themes with ColorMix.qvf
- Move Document
- Delete Document and Replies
- Mark as New
- Bookmark
- Subscribe
- Mute
- Subscribe to RSS Feed
- Permalink
- Report Inappropriate Content
Color Themes with ColorMix.qvf
Aug 4, 2022 6:22:03 AM
Feb 25, 2016 3:41:25 AM
Hi all
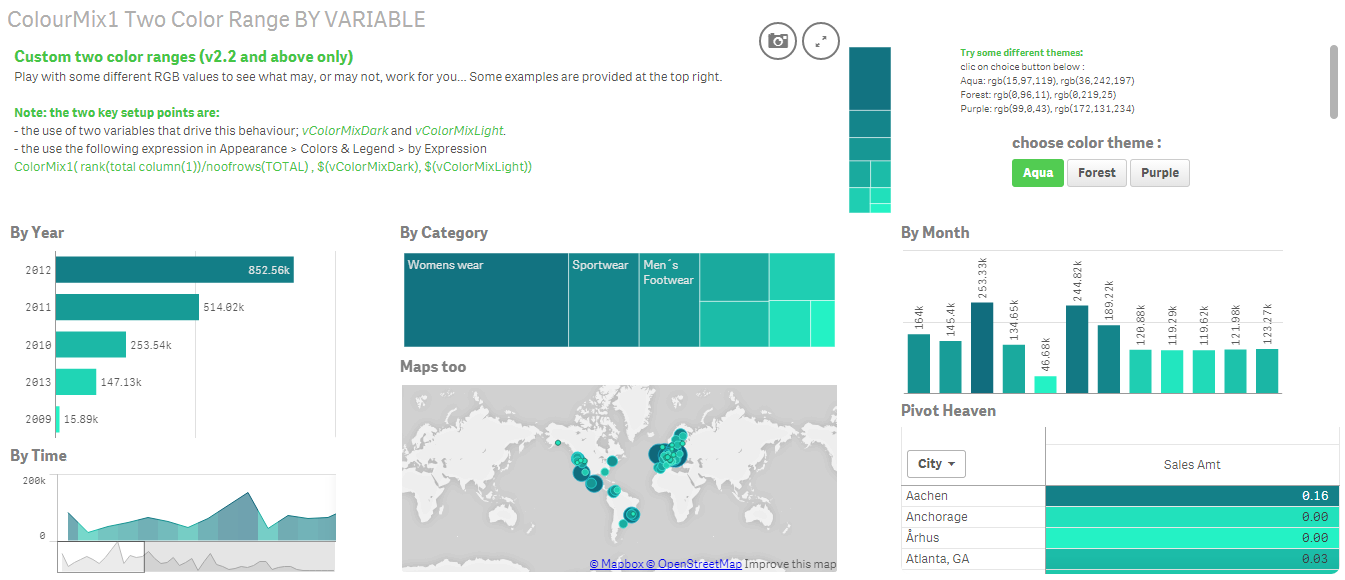
I saw recently this post about a very usefull and easy way to apply theme color in charts , map , gauge , crosstable and so on.
using colormix1 or colormix2 functions to set a range of colors depending of data , mesures, dimensions .. and using variable to define rgb colors in one time.
Thanks to ryy for this amazing exemple and sharing this App.
following this example I take avantage of this app and complete it with 2 others sheets.
First of them use variable button rather than imput text field to set color theme.

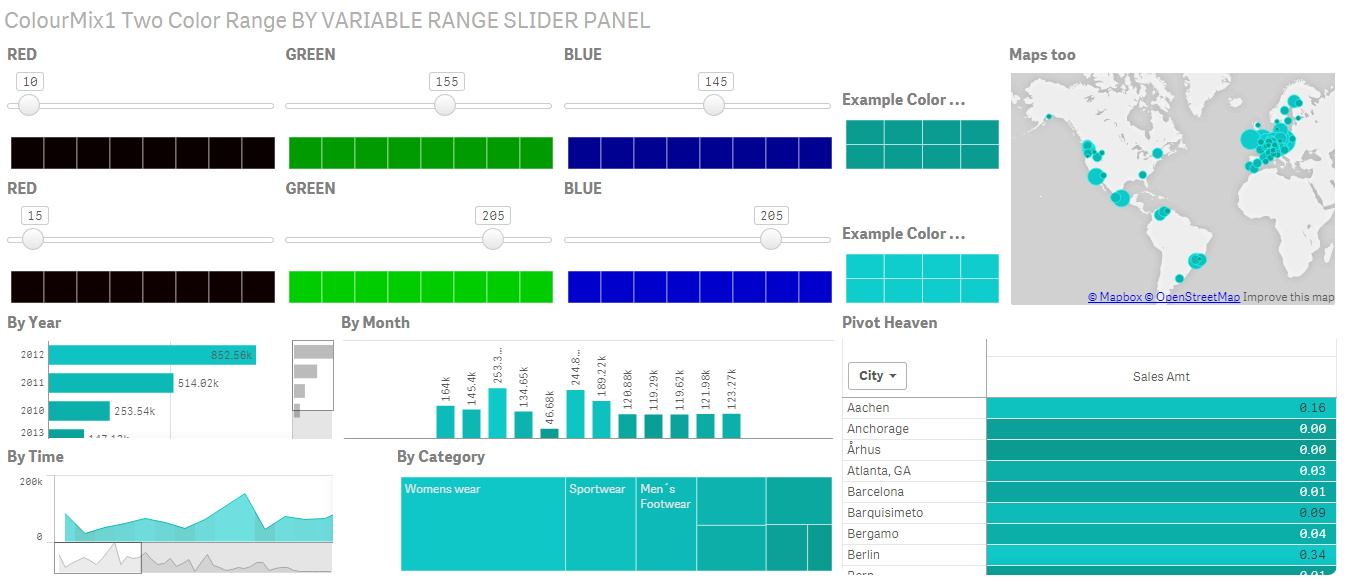
Second sheet added consists in a panel sheet to set up independantly for both dark color and light color the RGB values and see how colors are shading from one to the other :
I fixed 2 issues :
first : now by default in sheet with theme using variable button the app open by default on second theme 'Forest'
you can change the default theme by changing in variable panel the variable vcolorchoice figure 2 by 1 for aqua and 3 for purple theme.
second : in last sheet : set color theme by slider : by default the app open with predifined value in the differents sliders, so that charts are not displayed in grey.

hope it could be usefull
Bruno
- Move Comment
- Delete Comment
- Mark as Read
- Mark as New
- Bookmark
- Permalink
- Report Inappropriate Content
Hi Bruno,
That's a great way of extending the idea of themes and allowing users to see the color and not just the rgb() value.
Hopefully we'll see some additional color functionality coming through soon and I'm glad my post has proved useful for you.
Cheers
Richard
- Move Comment
- Delete Comment
- Mark as Read
- Mark as New
- Bookmark
- Permalink
- Report Inappropriate Content
Thanks![]()
- Move Comment
- Delete Comment
- Mark as Read
- Mark as New
- Bookmark
- Permalink
- Report Inappropriate Content
hi Bruno
After closing and opening the app color is not applied. and is it possible to change the color for the button.
- Move Comment
- Delete Comment
- Mark as Read
- Mark as New
- Bookmark
- Permalink
- Report Inappropriate Content
Hi Arul
I fixed the issues :
reload file attached.
first :
now by default in sheet with theme using variable button the app open by default on second theme 'Forest'
you can change the default theme by changing in variable panel the variable vcolorchoice value 2 by 1 for aqua and 3 for purple theme.
and if you want to change the theme color of buttons : change rgb values in the mesure include in the variable called vColor1 :
If(
vColorChoice=1,
ColorMix1( rank(total column(1))/noofrows(TOTAL) , rgb(15,97,119), rgb(36,242,197)),
if(vColorChoice=2,
ColorMix1( rank(total column(1))/noofrows(TOTAL) , rgb(0,96,11),rgb(0,219,25)),
if(vColorChoice=3,
ColorMix1( rank(total column(1))/noofrows(TOTAL) , rgb(99,0,43), rgb(172,131,234)))))
second : In last sheet : set color theme by slider : by default the app now open with predifined value in the differents sliders, so that charts are not displayed in grey when opening the app.
Hope that is what you need.
Bruno
- Move Comment
- Delete Comment
- Mark as Read
- Mark as New
- Bookmark
- Permalink
- Report Inappropriate Content
Thank you very much Bruno
- Move Comment
- Delete Comment
- Mark as Read
- Mark as New
- Bookmark
- Permalink
- Report Inappropriate Content
hi bruno bertels,
i am using this color option in sense server. in hub there is no variable editor. so i have done like this
set vcolor1 = If(vColorChoice=1,ColorMix1( rank(total column(1))/noofrows(TOTAL) , rgb(15,97,119), rgb(36,242,197)),if(vColorChoice=2,ColorMix1( rank(total column(1))/noofrows(TOTAL) , rgb(0,96,11),rgb(0,219,25)),if(vColorChoice=3,ColorMix1( rank(total column(1))/noofrows(TOTAL) , rgb(99,0,43), rgb(172,131,234)))));
set vColorChoice = 1;
but the color is not applied. can you check this one please.
- Move Comment
- Delete Comment
- Mark as Read
- Mark as New
- Bookmark
- Permalink
- Report Inappropriate Content
Hi Arul,
I only use QS desktop for personal use and did'nt manage QS server and hub so that i'am not sure to be able to help.
The color mesure is running well with QS 2.2 , so ensure your QS Server Version is upgraded to QS server 2.2.
In your case i would first test a color mesure without variable just to see if it's working in chart or table on server app:
add the color expression in one of your table or charts from an app installed on server :
ColorMix1( rank(total column(1))/noofrows(TOTAL) , rgb(15,97,119), rgb(36,242,197))
if this mesure work fine we've got a problem with the variable and not with the color mesure
if it doesn't work :
I guess qsvariable extension is installed on your server. This is the difference between QS desktop and QS server : in QS server the extension need to be installed on server : import the zip file dist\variable.zip in the QMC.
Bruno
- Move Comment
- Delete Comment
- Mark as Read
- Mark as New
- Bookmark
- Permalink
- Report Inappropriate Content
i tried the color code
ColorMix1( rank(total column(1))/noofrows(TOTAL) , rgb(15,97,119), rgb(36,242,197))
result is not like in desktop.
and extension also imported.
- Move Comment
- Delete Comment
- Mark as Read
- Mark as New
- Bookmark
- Permalink
- Report Inappropriate Content
hi
Try this replace column(1) by the mesure of your chart , for example sum(sales)
ColorMix1( rank(total [your measure expression here])/noofrows(TOTAL) , rgb(15,97,119), rgb(36,242,197))
Remember
ColorMix1( rank(total column(1))/noofrows(TOTAL) , rgb(15,97,119), rgb(36,242,197)) works in QS 2.2 in QS2.1 the term column() is not supported so you have to replace it with a mesure.
Bruno
- Move Comment
- Delete Comment
- Mark as Read
- Mark as New
- Bookmark
- Permalink
- Report Inappropriate Content
Excellent it works well like you said. but using variables is not working.
sense server 2.2 having variable editor?
thanks again bruno