Unlock a world of possibilities! Login now and discover the exclusive benefits awaiting you.
This forum is where any logged-in member can create a knowledge article.
Recent Documents
-
How To /Missing Manual (25 articles)
How To / Missing Manual QlikView functions explainedHeader 1Header 2123456789101112131415161718192... Show More
How To / Missing Manual
QlikView functions explainedDid You like it?

-
Calendars
A calendar is very useful when you want to link your data to different time periods, e.g. when you want to display your KPIs over different years or m... Show MoreA calendar is very useful when you want to link your data to different time periods, e.g. when you want to display your KPIs over different years or months. Often you only have one date and you just want to use a standard calendar. For this case, there are plenty of resources on this community. You can find a good overview on How to use - Master-Calendar and Date-Values..
If you have several date fields, you should most likely have several calendars defined in your script. See
Why You sometimes should Load a Master Table several times
If you want to use a non standard calendar, like a fiscal calendar or a 4-4-5 calendar, the challenge becomes more difficult. See e.g. Fiscal Yearor Recipe for a 4-4-5 Calendar.
The script posted here will help you create a more complicated calendar. It has parametrized examples for the following calendars:
- Standard Gregorian month-based calendar
- Standard Gregorian week-based calendar
- Standard Gregorian week-based calendar with broken weeks
The first and last weeks of the year do not span the shift of the year and they do not necessarily have 7 days - Month-based fiscal calendar
The Gregorian months are used as fiscal months, but January is not necessarily the first month of the fiscal year. - Week-based 4-4-4 calendar
The fiscal year is divided into 13 months with 4 weeks each. Occasionally there is a 14th month with one week. - Week-based 4-4-5 calendar
The fiscal year is divided into 4 quarters, each with 3 months. The first month of the quarter has 4 weeks, the second has 4 weeks, and the last has 5 weeks. Occasionally the last month of the year has an additional week. - Week-based 4-5-4 calendar
The fiscal year is divided into 4 quarters, each with 3 months. The first month of the quarter has 4 weeks, the second has 5 weeks, and the last has 4 weeks. Occasionally the last month of the year has an additional week. - Week-based 5-4-4 calendar
The fiscal year is divided into 4 quarters, each with 3 months. The first month of the quarter has 5 weeks, the second has 4 weeks, and the last has 4 weeks. Occasionally the last month of the year has an additional week. - Broadcast calendar
The months are week-based and start on the first day of the week that contains the first day of the Gregorian month.
There are several parameters that you can use to configure your calendar: The first month of the year, the first day of the week and the first week of the week-based year.
The script is commented, so hopefully you can read it and understand it. You can paste it straight into an empty app and run it to evaluate how it works. If you want to use parts of it inside one of your own apps, you may need to rename some fields.
The script should work in both Qlik Sense and QlikView.
Good Luck!
HIC
-
Important Message Regarding QlikView Documents
For the interim, no new articles can be published. This is because we are consolidating knowledge articles to one location. If you have any question... Show More -
QlikView App - Generic Data Profiler
Often when building QlikView applications, or picking up applications which have been built by someone else I want to have a quick and easy way of vie... Show MoreOften when building QlikView applications, or picking up applications which have been built by someone else I want to have a quick and easy way of viewing the data that is in that application. To enable me to do this I have put together a page of objects that lists all tables and fields in the data model and then gives outline information about any selected field. These objects can be copied and pasted into any QlikView application to view the data model of that document.
I have documented how this document works and the reasons why you might use it in a blog post here:
https://www.quickintelligence.co.uk/qlikview-data-profiler/
Please see the blog post for further details on using this document.
There is now a Qlik Sense version of this app, which you can find on Qlik Community here:
Qlik Sense App: Generic Data Profiler
I hope that you find it useful. You will find other applications that I have uploaded under my profile on QlikCommunity, or on our Downloads Page.
Steve
https://www.quickintelligence.co.uk/blog/
PLEASE NOTE: The 'With Mask' version of the file includes an experimental tab that may or may not work well on large data sets. Please see comment below for details. If you are not sure which to download go for DataProfiler.qvw. Thanks!
-
Generating Missing Data In QlikView
What techniques are there to generate “new” tables; tables that don’t exist in the source data?How do I loop over one and the same record in source da... Show More- What techniques are there to generate “new” tables; tables that don’t exist in the source data?
- How do I loop over one and the same record in source data?
- How do I propagate a value from above record to the current one?
- How do I populate a sparsely populated field?
- How do I generate all combinations – the Cartesian product – of two or more fields?
- How do I make simulations in QlikView?
These questions and others are answered in this Technical Brief.
-
Non-Gregorian calendars
There are many non-Gregorian calendars used in the world today. This page posts Qlik scripts for some of them.The Julian calendarThe Julian calendar i... Show MoreThere are many non-Gregorian calendars used in the world today. This page posts Qlik scripts for some of them.
The Julian calendar
The Julian calendar is easy to recreate in a master calendar in a Qlik app. All you need to do is to generate all days in a four-year cycle and assign the appropriate months and day numbers. The file JULN_Script.txt contains a script that does this.
The Hijri calendar
The Hijri calendar, or Islamic calendar, is a purely lunar calendar, containing 12 months based on the motion of the moon. This means that the Hijri year always is shorter than the tropical year, and therefore it shifts with respect to the Gregorian calendar.
To create a Hijri calendar, you need a table containing the month starts (HIJR_Calendar.txt). From this, you can generate the master calendar of your data model. Attached you will also find tables containing template month names and day names. All files for the Hijri calendar have the HIJR prefix.
This calendar, like any other Hijri calendar based on calculation, only gives an estimated date. The calendar is not based on the actual sighting of the moon, which is required for the beginning of some of the months. For a proper calendar you should contact your local Muslim scholar.
The Hebrew calendar
The Hebrew calendar is used today predominantly for Jewish religious observances. It is a lunisolar calendar with 12 months based on the motion of the moon. However, to prevent the year from shifting with respect to the seasons, a leap month is inserted approximately every third year.
To create a Hebrew calendar, you need a table containing the month starts (HEBR_Calendar.txt). From this, you can generate the master calendar of your data model. Attached you will also find tables containing template month names and day names. All files for the Hebrew calendar have the HEBR prefix.
The Shamsi calendar
The Shamsi calendar, also known as Persian calendar or the Jalaali Calendar, is a purely solar calendar, containing 12 months based on the zodiac constellations. The year always starts at the vernal equinox as seen from the Tehran horizon. This means that the Shamsi calendar never shifts with respect to the seasons.
To create a Shamsi calendar, you need a table containing the vernal equinoxes (EQNX_Equinoxes.txt). From this, you can generate the master calendar of your data model. Attached you will also find tables containing template month names and day names. All files for the Shamsi calendar have the SHMS prefix. You also need the file EQNX_Equinoxes.txt.
The French Republican calendar
The French Republican calendar, also called the French Revolutionary calendar, was the official calendar in France from 1793 to 1805. It is a purely solar calendar, containing 12 months with 30 days each, and an additional 5-6 days at the end of the year. In this version, the year always starts at the autumnal equinox as seen from the Paris horizon. This means that it never shifts with respect to the seasons.
To create a French Republican calendar, you need a table containing the autumnal equinoxes expressed as Gregorian dates (EQNX_Equinoxes.txt). From this, you can generate a French Republican master calendar for your data model. Attached you will also find tables containing month names and day names. All files for the French Republican calendar have the FREP prefix. You also need the file EQNX_Equinoxes.txt.
About the scripts
The scripts generate a number of fields, e.g. Year, Month, Day of month and full date. All fields are dual where applicable, so they are correctly sorted.
The algorithms used for these five calendars are not identical, but they are similar. The basic structure is:
- Load the year starts (or month starts) as Gregorian dates from an external table. Or generate them from some deterministic rule.
- Generate all Gregorian dates between one year start and the next.
- Load non-Gregorian month names and other data from external tables, and join these onto the calendar using the appropriate key, e.g. non-Gregorian month number.
Script files are named XXXX_Script.txt. Each of the script files will run as it is if you include it in an empty app and place the other source files in the same folder as the app. To use the script in an existing app, you need to remove the mock-up fact table from the script, and maybe rename some of the fields.
The information in the source files have been compiled from different open sources. They may contain errors and QlikTech cannot assume any responsibility for such errors or what these errors may lead to when the data is used. Consider the files as templates for how to solve the challenge of implementing a non-Gregorian calendar. Use at your own risk and verify that the content meets the requirements that you have.
See also the corresponding blog post: Non-Gregorian calendars.
-
Hierarchies
Hierarchies are an important part of all business intelligence solutions, used to describe dimensions that naturally contain different levels of granu... Show MoreHierarchies are an important part of all business intelligence solutions, used to describe dimensions that naturally contain different levels of granularity. Some are simple and intuitive whereas others are complex and demand a lot of thinking to be modeled correctly.
- What is the difference between a balanced and an unbalanced hierarchy?
- How can a hierarchy be loaded into QlikView?
- Which data model should be used?
- How do I create an authorization scheme using a hierarchy?
- How can I check for data integrity problems in the hierarchy data?
These questions and others are answered in this Technical Brief. Attached you will also find a sample unbalanced, n-level hierarchy along with the script to load it.
See also the following blog posts:
Unbalanced, n-level hierarchies
Authorization using a Hierarchy
2013-11-26: Added section on authorization.
-
How to use- Dual()
Have you ever wonder how the examples from the Qlikview help may look like?Please see below and enjoy responsibly...Dual()Definition:Forced associatio... Show MoreHave you ever wonder how the examples from the Qlikview help may look like?
Please see below and enjoy responsibly...
Dual()
Definition:
Forced association of an arbitrary string representation s with a given number representation x. In QlikView, when several data items read into one field have different string representations but the same valid number representation, they will all share the first string representation encountered. The dual function is typically used early in the script, before other data is read into the field concerned, in order to create that first string representation, which will be shown in list boxes etc.
Syntax:

where
text - this is first column of data
number- this is second column of data

Qlikview has specific way of storing data. Each field is represented by Text and Number data type called dual.
The Text format is visible to user and the Number is being used for calculation and sorting.

You can imagine that each field has top Text layer and bottom
(like salad in your Hamburger) Number layer.
This association works most of the time and for most of the data type but there are situation that we need to force this association to work the way we want.
Preparation
- To use the script below the csv file must be saved in the same folder that your qvd file
Qlik help example contains two tables: inline and from csv file(sample attached)
load dual ( string,numrep ) as DayOfWeek inline
[ string,numrep
Monday,0
Tuesday,1
Wednesday,2
Thursday,3
Friday,4
Saturday,5
Sunday,6 ];
Directory;
LOAD Date,
Sales
FROM
afile.csv
(txt, codepage is 1252, embedded labels, delimiter is ',', msq);
//The last line is not part of Qlikview help but you have to have this line to correctly load data into Qlikview
after Reload we have:

As you probably know when Values are on the left hand side they represent Text when on the right Number.
So why we have Text on the right?
In the background (during load) the numbers have been associated with the text.
So what you see is the bun what you do not is the underlay salad:

Practical use:
Example 1
The simple but maybe not the most
useful calculation
is to add Days of the week from our data
=sum(DayOfWeek)

Example 2
Counting days of the week:
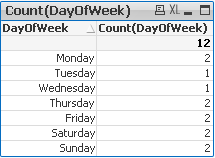
Example 3
(please use attached xlsx file and below Script)
A survey has been conducted and the data in Excel file looks like this:
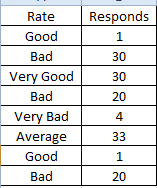
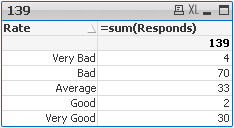
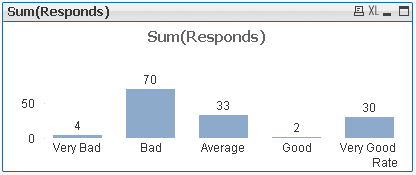
What we want is to assign more meaningful description to the rate numbers.
Script:
Data:
mapping load * Inline
[ Rate,Value
Very Good,5
Good,4
Average,3
Bad,2
Very Bad,1
]
;
Sort:
load
Responds,
dual(Rate,ApplyMap('Data',Rate)) as Rate
FROM
Survey.xlsx
(ooxml, embedded labels, table is Sheet1);
Now we can create Straight Table or bar Bar Chart:
This function can be use in many different ways.Please research our community to find more examples.
Still feeling hungry?
Do you Qualify?- How to use QUALIFY statement
Missing Manual - GetFieldSelections() + Bonus Example
MaxString & MinString - How to + examples
The second dimension... or how to use secondarydimensionality()
-
Joins and Lookups
This document concerns data modelling and joinsWhat is the difference between a join using the join prefix and a join using a SELECT statement?When sh... Show MoreThis document concerns data modelling and joins
- What is the difference between a join using the join prefix and a join using a SELECT statement?
- When should you join and when shouldn't you? Performance considerations?
- Are there alternatives to joins? (Yes! Applymap!)
- What does the Keep prefix do?
See also my blog post on the same subject: To Join or not to Join.
-
Missing Manual - Map...using
Have you ever wondered how the examples from the Qlikview help may look like?Please see below and enjoy responsibly...Map...usingor some... Show More
Have you ever wondered how the examples from the Qlikview help may look like?
Please see below and enjoy responsibly...
Map...using
or some kind of a lookup...
In most of the cases we want to keep current field and by mapping corresponding values create new Field.
(Don't join - use Applymap instead)
But sometimes we want to replace data with new one.
Here is where map...using comes in handy..

Description(Qlikview Help)
The map ... using statement is used for mapping a certain field value or expression to the values of a specific mapping table. The mapping table is created through the Mapping statement.
The automatic mapping is done for fields loaded after the map ... using statement until the end of the script or until an unmap statement is encountered.
The mapping is done last in the chain of events leading up to the field being stored in the internal table in QlikView. This means that mapping is not done every time a field name is encountered as part of an expression, but rather when the value is stored under the field name in the internal table. If mapping on the expression level is required, the Applymap() function has to be used instead.
Syntax:

*Fieldlist - is name of the field which value we will be look for
mapname - us the table from where the data will be picked

Replacing matching fields values with corresponding values from the Mapping Table
- Mapping Table must have only two columns
- The fields/tables to be replaced (or map) must be loaded after the map..using statement
Data Model (Example 1)
Header 1 Header 2 (Copy and Pasted below code into Edit Script window and reload)
Cmap:
MAPPING LOAD * INLINE [
Code,Country
PL,Poland
UK,United Kindgdom
DE,Germany
];
Map Country Using Cmap;
Data:
LOAD * INLINE [
Country
PL
GB
DE
FR
];
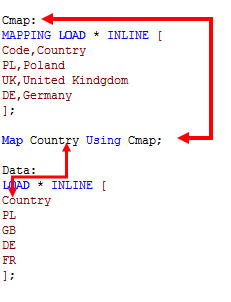
The outcome is as below:

PL - have been replaced by Poland
DE - have been replaced by Germany
FR and GB - does not have a match in Cmap table
Data Model (Example 2 & 3)
X:
MAPPING LOAD * INLINE [
Code,Country
PL,Poland
UK,United Kindgdom
DE,Germany
];
map A, B, C using X;
Data:
LOAD * INLINE [
A, B ,C
PL, GB,DE
GB, PL,FR
DE, FR,PL
FR, DE,GB
];
Outcome:
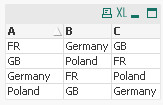
In this example matching values from all three fields have been replaced by corresponding values.
The A,B,C field names can replaced by * (Example 3) to get the same outcome
map * using X;
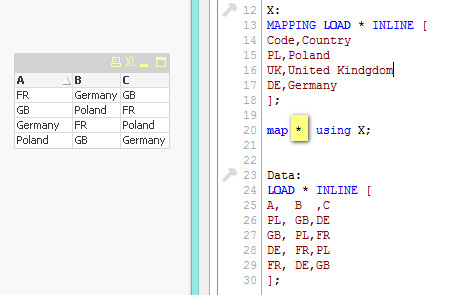
If you wonder where this statement may be useful , think of a model with more than one table where values have to be replaced
In below example all fields that have been stated as map criteria (A,B,C,G - no matter which table ) have been replaced by corresponding values:
Header 1 Header 2 X:
MAPPING LOAD * INLINE [
Code,Country
PL,Poland
UK,United Kindgdom
DE,Germany
];
map A,B,C,G using X;
Data:
LOAD * INLINE [
A, B ,C
PL, GB,DE
GB, PL,FR
DE, FR,PL
FR, DE,GB
];
Data2:
LOAD * INLINE [
E, F ,G
PL, GB,DE
GB, PL,FR
DE, FR,PL
FR, DE,GB
];
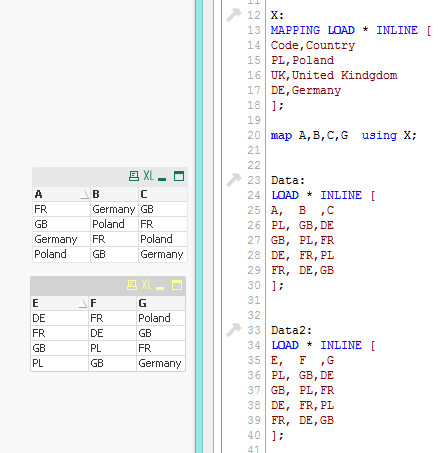
Feeling Qlikngry?
-
What if analysis in Qlik Sense
Dear all,Sharing simple example of What if analysis in Qlik Sense using Slider extensionGitHub - mhamano/qlik-sense-slider: Qlik Sense extension for a... Show MoreDear all,
Sharing simple example of What if analysis in Qlik Sense using Slider extension
GitHub - mhamano/qlik-sense-slider: Qlik Sense extension for a slider object
Hope will be good start for beginners
Vikas
-
QlikView App - Structure File Viewer
QlikView creates a number of log files and XML files. From project folders through to reload logs and QMC schedules. Perhaps unsurprisingly the best... Show MoreQlikView creates a number of log files and XML files. From project folders through to reload logs and QMC schedules. Perhaps unsurprisingly the best tool to consume these files is QlikView itself.
This application loads the structure files that QlikView allows you to extract based on the data model of the currently open app. It then gives a few simple ways of viewing that information.
There is an accompanying blog post describing the ways that you can use the structure files created by QlikView, and apps such as this to quickly get a handle on a new data source and work out a plan of attack to analyse it.
This can be found here:
http://www.quickintelligence.co.uk/qlikview-data-structures/
There is also a list of the other apps that I have made available on Qlik Community on the site, here:
http://www.quickintelligence.co.uk/qlikview-examples/
If you have any questions about the application, or suggestions on how it could be improved, please leave these below or in the comments on the blog post itself.
Steve
-
Missing Manual - Peek()
Have you ever wondered how the examples from the Qlikview help may look like?Please see below and enjoy responsibly...Peek()not a boo...... Show More
Have you ever wondered how the examples from the Qlikview help may look like?
Please see below and enjoy responsibly...
Peek()
not a boo...
This function belongs to to Inter-Record functions and can only be used in the script (back-end).

Description(Qlikview Help)
Returns the contents of the fieldname in the record specified by row in the internal table tablename. Data are fetched from the associative QlikView database.
Fieldname must be given as a string (e.g. a quoted literal).
Row must be an integer. 0 denotes the first record, 1 the second and so on. Negative numbers indicate order from the end of the table. -1 denotes the last record read.
If no row is stated, -1 is assumed.
Tablename is a table label without the ending colon. If no tablename is stated, the current table is assumed. If used outside the load statement or referring to another table, the tablename must be included.
Syntax:

Field_name - is a name of of your field(column)
row_no - the row from which the data is returned
(0 is first row
1 is second row
and so on..
-1 is the last row)
table_name - a name of table from where the data are fetched

Returns values from previous row or row specified by the row-no argument.
- If no row is stated, -1 is assumed.
- you can reference field that was not been previously loaded (created on the with AS alias)(See "Bonus 2" example)
- From the Help description "Fieldname must be given as a string (e.g. a quoted literal)."
This is true only if we use this function to create variable (please see below examples)
Data Model
(Copy and Pasted below code into Edit Script window and reload)Tab1:
load
peek(Sales) as S1,
peek( Sales,2 ) as S2,
peek( Sales,-2 ) as S3,
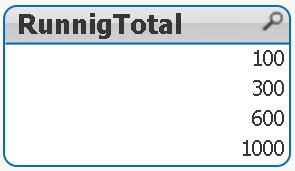
if(rowno()=1,Sales,Peek(RunnigTotal,-1)+Sales) as RunnigTotal,
Previous(Sales) as PSales,
numsum( Sales, peek( 'Sales' ) ) as Bsum,
Sales
inline [
Sales
100
200
300
400
]
;
load
peek( Sales, 0, 'Tab1' )as S4
resident Tab1;
LET vpeek= peek( 'Sales', -1, 'Tab1' ) ;
 Please see below swuehl comments about difference when you use negative or positive numbers as second argument.
Is worth to mention that Peek() is reading from Output table(opposite to Previous() function which reads from Input Table.
Example:
OutputTable:
LOAD field
RESIDENT InputTable;
source:Difference between peek() and previous() funcation
Example 1
In this example as we did not specify the row_no argument, all but last rows are returned.
peek( 'Sales' )
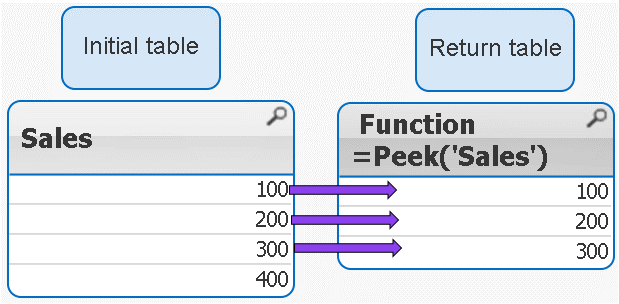
 peek( 'Sales' ) = peek( 'Sales',-1)
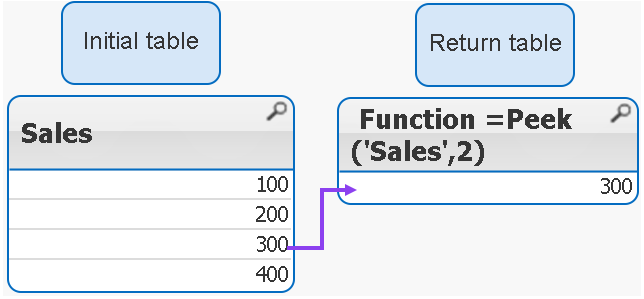
Example 2
IF the row_no argument is added only ONE value is returned
peek( 'Sales',2 )
 Remember 2 = third row
Example 3
If we use negatives numbers as row_no the return value is our initial table minus number of rows specified by the second argument.
peek( 'Sales',-2 )

As you see the last 2 rows have been removed from the table.
Example 4
The below syntax is used when we want to return value from external table(see data model)
peek( 'Sales', 0, 'Tab1' ) as S4

Example 5
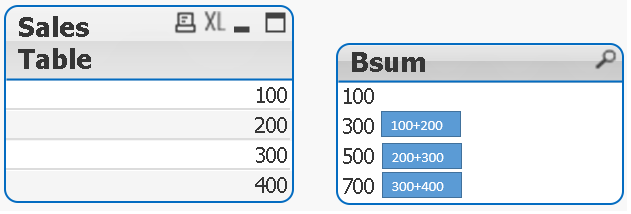
Each row is a SUM of current row + one row above.
numsum( Sales, peek( 'Sales' ) ) as Bsum
Bonus
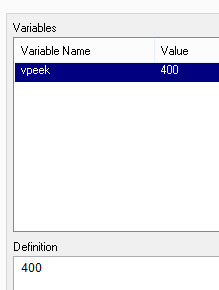
How to store value into variable:
With below example
LET vpeek= peek( 'Sales', -1, 'Tab1' ) ;
we will store value of 400 in variable vpeek
and then use in front end development.
Bonus 2
As previously stated we can use Peek to return values from field that was not been yet created.
How does it wok?
In our data model we have this line:
if(rowno()=1,Sales,Peek(RunnigTotal,-1)+Sales) as RunnigTotal,
Although RuningTotal has not yet been loaded we can return the values from that line:
Still feeling Qlikngry?
-
Incremental Load in Qlikview - Sources
Hi All,This is the collection of Incremental Load in Qlikview.Hope this will help you.Thank you.Incremental Load.docxScript for Incremental Loading of... Show MoreHi All,
This is the collection of Incremental Load in Qlikview.
Hope this will help you.
Thank you.
Script for Incremental Loading of Multiple QVDs from a List of Table Names
Incremental Load Scenarios.pdf
incremental load issue while executing
Different Ways to load data in qlikview
Partial Reload Easy and Simple
Switch Between Full Load And Incremental Load
Re: Incremental Load in Script
Concatenate Incremental logic for Deleted records
-
QlikView App: Accumulate values in the Data Model
This example QlikView app shows a number of different ways that values can be accumulated by loading associated tables based on the existing data.Thre... Show MoreThis example QlikView app shows a number of different ways that values can be accumulated by loading associated tables based on the existing data.
Three scenarios are looked at:
A straight accumulation of values that accumulate to match a total over a number of days.
A moving annual total where for each period 12 months of values are rolled up.
Creating an Average bar appearing as an extra bar within a bar chart
In all cases a new dimension is created to allow for the total to be created.
This document was produced to support the Quick Intelligence Blog posting Accumulate Values In The QlikView Data Model. This blog discusses the techniques used so that you can use them in your own documents.
Please see my other documents uploaded to Qlik Community for further tutorials and examples.
Many thanks,
Steve Dark
-
QlikView App: Create list boxes that work in an OR mode
In October 2013 the QlikView Masters Summit came to London. During the event there was a Quiz the Masters session and the question was asked was ther... Show MoreIn October 2013 the QlikView Masters Summit came to London. During the event there was a Quiz the Masters session and the question was asked was there a way to create ListBoxes that work in a OR fashion rather than an AND.
At the time no one could think of a simple way of achieving this - but I thought I would try a few things out. This document is some of my workings.
The first attempt was based on creating a linked table with all values in for each field that was to be included in the and. These would be split into separate list boxes with Expressions in the List Box. Unfortunately although those selections should not be mutually exclusive - from a data model perspective - they are.
The second attempt kind of worked - but looked pretty bad. The values from each of the fields were placed in a single field with a prefix showing which field they had come from. Selections could then be made from values from each of the source fields and the resultant selections did give an AND of the values. It was a kind of solution.
The third attempt works and the list boxes look exactly like the natural list boxes. This is achieved by loading every value for each field that needs to be used in the OR into a separate table stored as a Data Island. By changing any expressions to use Set Analysis and a P modifier looking at the data islands values can be found for any rows where a selection is made in any of the fields. This ticks the boxes (I believe) for answering the question.
However.... I would really not recommend the third approach as it requires duplication of much of the data model in memory and could perform very badly. Also, if a user was to pick one of the data island fields when they thought they were picking an actual dimension things could go very bad with a Cartesian product occurring. Perhaps a Hide Prefix on those fields would make it less risky though.
So, at the end of the day - this is very much open for discussion and I would welcome any further suggestions on how this could be achieved.
Happy Qliking
Steve
http://www.quickintelligence.co.uk/qlikview-blog/
[Note: there is a function called AND MODE in QlikView and this works in simple cases. It wasn't deemed appropriate for this solution though]
-
Primer for QlikView Date fields
QlikView has an intelligent algorithm to recognize dates independently of which region you are in. In most cases, you will have no problems loading th... Show MoreQlikView has an intelligent algorithm to recognize dates independently of which region you are in. In most cases, you will have no problems loading them. It just works and you do not need to think about it. However, in some cases dates are not properly recognized and then you need to add some code in the script to make it work.


