Unlock a world of possibilities! Login now and discover the exclusive benefits awaiting you.
- Qlik Community
- :
- Forums
- :
- Analytics
- :
- New to Qlik Analytics
- :
- Can I add table into bar chart?
- Subscribe to RSS Feed
- Mark Topic as New
- Mark Topic as Read
- Float this Topic for Current User
- Bookmark
- Subscribe
- Mute
- Printer Friendly Page
- Mark as New
- Bookmark
- Subscribe
- Mute
- Subscribe to RSS Feed
- Permalink
- Report Inappropriate Content
Can I add table into bar chart?
I have a bar chart.
Goal: I would like to copy and paste my table into the bar chart.
Instead of having my table underneath the chart, I want it in the chart. Is there a way to do that?

| Frog | Dog |
| Cat | Mouse |
- Mark as New
- Bookmark
- Subscribe
- Mute
- Subscribe to RSS Feed
- Permalink
- Report Inappropriate Content
Hi @Breezy
By using the tooltip option you can add a small table that will be visible when you mouse over a dimension
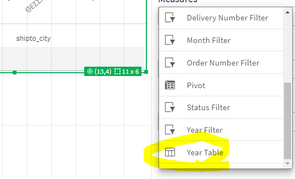
first create your table and add it as a master item
the, look for the tooltip option in your bar chart and select add master item
now when you mouse over
hope this helps.
Best,
help users find answers! Don't forget to mark a solution that worked for you & to smash the like button! 😁
- Mark as New
- Bookmark
- Subscribe
- Mute
- Subscribe to RSS Feed
- Permalink
- Report Inappropriate Content
Hi, thank you for taking the time to provide that info. That is helpful and it is making my chart nicer.
I am still wondering though, is there a way to position a table on the chart so the table never changes content? I want it to not matter what bar I hover over. I would want it to work even if I am not hovering on any bar. For example, if I were in PowerPoint and pasted a table ontop of a chart (purely formatting).
- Mark as New
- Bookmark
- Subscribe
- Mute
- Subscribe to RSS Feed
- Permalink
- Report Inappropriate Content
ok, by default you cannot overlap object in Qlik Sense.
but, you can do so some tweaking using the multi KPI object
https://www.youtube.com/watch?v=nLfTeEkB02U
Also, even though I don't usually suggest the use of extensions due to lack of support, @IVAN-FELIPE from the Qlik Iberia team, develop and maintains a very good one that allows many crazy things.
https://community.qlik.com/t5/Qlik-Sense-Documents/QS-UX-Pushing-Boundaries-BeautifyMe/ta-p/1890541
https://github.com/iviasensio/BeautifyMe
Hope this helps.
Best,
help users find answers! Don't forget to mark a solution that worked for you & to smash the like button! 😁
- Mark as New
- Bookmark
- Subscribe
- Mute
- Subscribe to RSS Feed
- Permalink
- Report Inappropriate Content
Thank you.
- Mark as New
- Bookmark
- Subscribe
- Mute
- Subscribe to RSS Feed
- Permalink
- Report Inappropriate Content
Well there is a way using some advanced CSS, and would require some tweaking along with the sizing of the data. If you don't want to go through the process, you can use some extensions available over qlik garden or branch.
- Mark as New
- Bookmark
- Subscribe
- Mute
- Subscribe to RSS Feed
- Permalink
- Report Inappropriate Content
Hi, oh I don't know CSS. What is "Qlik Garden" or "Branch"? I use Qlik Cloud so not sure where to find those extensions.
- Mark as New
- Bookmark
- Subscribe
- Mute
- Subscribe to RSS Feed
- Permalink
- Report Inappropriate Content
Both are sites for getting the verified extensions.


