Unlock a world of possibilities! Login now and discover the exclusive benefits awaiting you.
- Qlik Community
- :
- All Forums
- :
- Visualization and Usability
- :
- Display Aggregate values
- Subscribe to RSS Feed
- Mark Topic as New
- Mark Topic as Read
- Float this Topic for Current User
- Bookmark
- Subscribe
- Mute
- Printer Friendly Page
- Mark as New
- Bookmark
- Subscribe
- Mute
- Subscribe to RSS Feed
- Permalink
- Report Inappropriate Content
Display Aggregate values
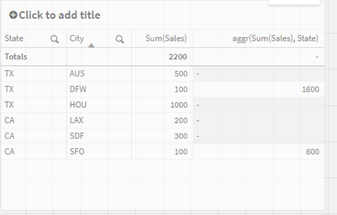
I have a visualization with State, City and Sales . In 4th column I want to display total sales for individual State.
Instead of displaying "-" at city level I want to display total sales as shown below:
State City Sales
CA SFO 100 600
CA LAX 200 600
CA SDF 300 600
TX DFW 100 1600
TX AUS 500 1600
TX HOU 1000 1600
How can I change the visualization ?
Also I have a State and City Filter. Can it display all states and cities by ignoring the filter values?
Accepted Solutions
- Mark as New
- Bookmark
- Subscribe
- Mute
- Subscribe to RSS Feed
- Permalink
- Report Inappropriate Content
Hi MH376,
1. Try this
Aggr(NoDistinct Sum(Sales),State)
Then you can display total sales for individual State.
2. If you add Set analysis, display all states and cities by ignoring the filter values.
Set =
{<State=,City=>}
Reply, thanks.
