Unlock a world of possibilities! Login now and discover the exclusive benefits awaiting you.
- Qlik Community
- :
- Forums
- :
- Analytics
- :
- New to Qlik Analytics
- :
- Graph with more than 2 dimensions
Options
- Subscribe to RSS Feed
- Mark Topic as New
- Mark Topic as Read
- Float this Topic for Current User
- Bookmark
- Subscribe
- Mute
- Printer Friendly Page
Turn on suggestions
Auto-suggest helps you quickly narrow down your search results by suggesting possible matches as you type.
Showing results for
Contributor
2020-07-24
09:35 PM
- Mark as New
- Bookmark
- Subscribe
- Mute
- Subscribe to RSS Feed
- Permalink
- Report Inappropriate Content
Graph with more than 2 dimensions
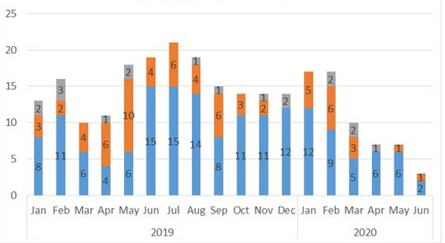
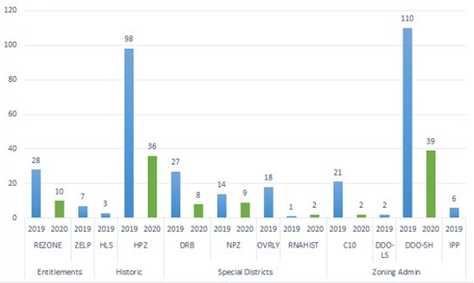
Is it possible to re-create graphs like these with more than 2 dimensions?
Or to create a graph from a pivot table like this?
The source data is a raw table that includes a record for each activity, to which I added the MetricsCategory, Year and MonthName fields.
- Tags:
- pivot tables
465 Views
0 Replies
Community Browser


