Not applicable
2016-06-08
10:55 AM
- Mark as New
- Bookmark
- Subscribe
- Mute
- Subscribe to RSS Feed
- Permalink
- Report Inappropriate Content
¿How set up colors in graph?
Hi there,
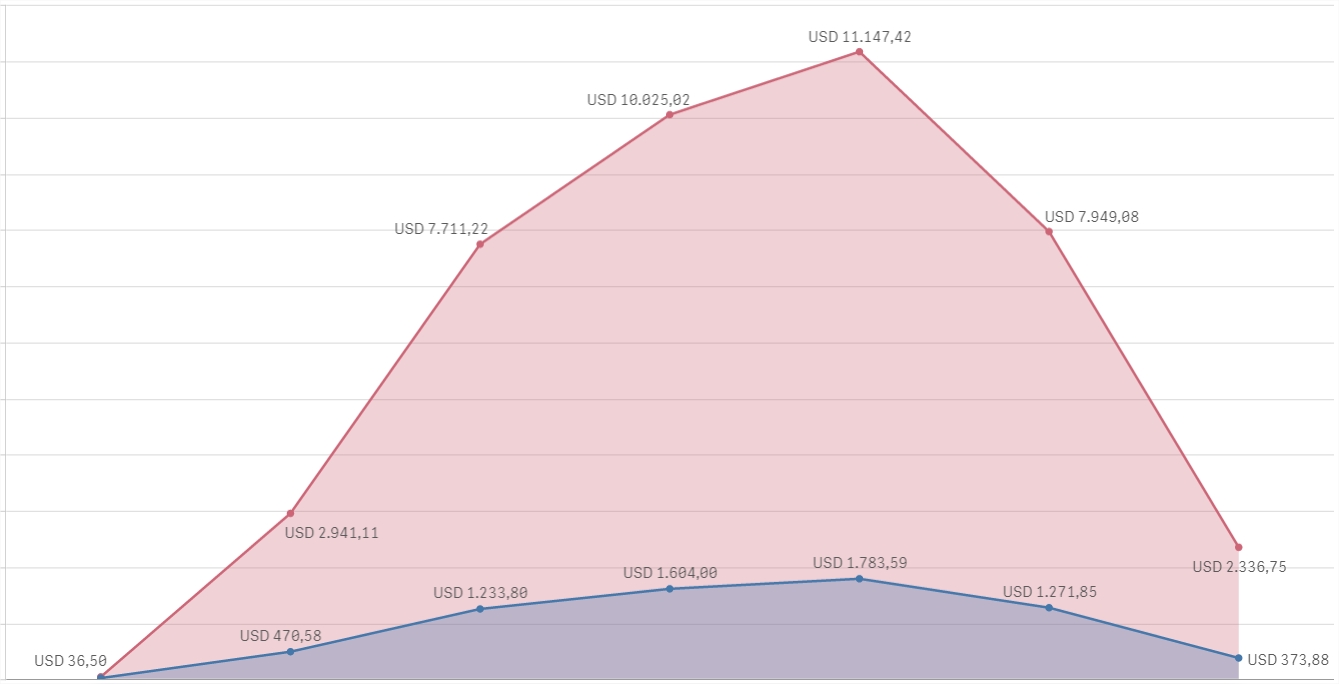
I have the following linechart:

I need to modify this colors, i have the following expressions:
Expression: SUM(Total)
Expression: SUM(Total)/Count(Element)
I need to change the RED color to Blue and the BLUE color to Green.
Thanks in advance.
871 Views
2 Replies
Anonymous
Not applicable
2016-06-08
02:16 PM
Author
- Mark as New
- Bookmark
- Subscribe
- Mute
- Subscribe to RSS Feed
- Permalink
- Report Inappropriate Content
This post might help color by expression - QlikSense
771 Views
Not applicable
2016-06-08
02:30 PM
Author
- Mark as New
- Bookmark
- Subscribe
- Mute
- Subscribe to RSS Feed
- Permalink
- Report Inappropriate Content
771 Views