- Mark as New
- Bookmark
- Subscribe
- Mute
- Subscribe to RSS Feed
- Permalink
- Report Inappropriate Content
Piechart legend with both value and Arguments
Hi,
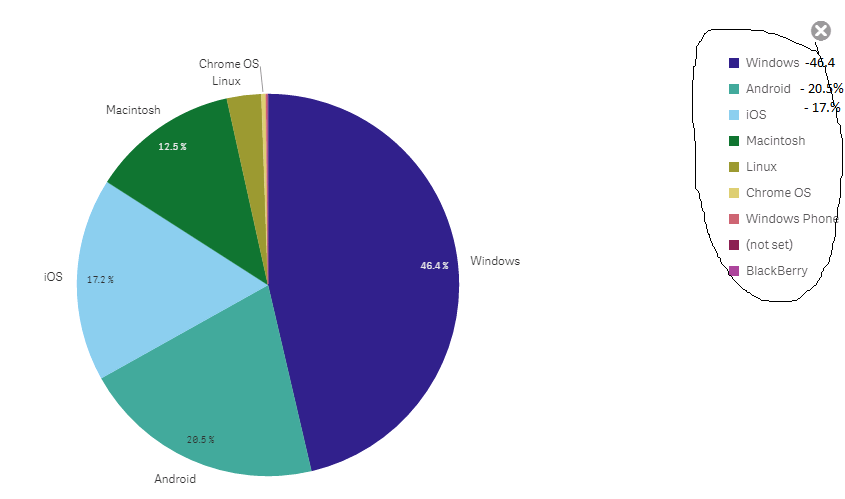
i have a pie chart as shown below with os names for this i need to show legend with both values and Arguments. How colud i show that in Qliksense.

Any help is appreciated.
- Tags:
- pie chart legend
- Mark as New
- Bookmark
- Subscribe
- Mute
- Subscribe to RSS Feed
- Permalink
- Report Inappropriate Content
Hi
do you want to show like
Windows - 40.4%
Andruid - 20.5 %??
- Mark as New
- Bookmark
- Subscribe
- Mute
- Subscribe to RSS Feed
- Permalink
- Report Inappropriate Content
Hi
I am assuming OSNAMES and sales are your field names ....
Dual(OSNAMES & '-' & Num(sum(Sales), '#,##0') & Repeat(chr(13)&chr(10), rank(Sum(Sales))-6), sum(Sales) )
or
Dual(OSNAMES & '-' & Num(sum(Sales), '#,##0') , sum(Sales) )
- Mark as New
- Bookmark
- Subscribe
- Mute
- Subscribe to RSS Feed
- Permalink
- Report Inappropriate Content
Only your dimensions will show on Legend.
You might not be able to see as the legend hides if the size of the chart is small. Expand the size of the chart and you'll see the legend.
- Mark as New
- Bookmark
- Subscribe
- Mute
- Subscribe to RSS Feed
- Permalink
- Report Inappropriate Content
Hi allu,
yes, in legend i need to show like below
Windows - 40.4%
Andruid - 20.5 %
Where should i had your given expreesion?
- Mark as New
- Bookmark
- Subscribe
- Mute
- Subscribe to RSS Feed
- Permalink
- Report Inappropriate Content
do you want the output like attached screen shot ?
- Mark as New
- Bookmark
- Subscribe
- Mute
- Subscribe to RSS Feed
- Permalink
- Report Inappropriate Content
I guess she's working on Qlik Sense, not on QlikView.
I don't think it is possible to show both Dim & Measure at the same time. By default we do not have option to show Values on Data point with Dim along side it.
Given the grid space in Qlik Sense is not large as Qlikview so Charts has to be adjusted within that...
But I think when a user hover their mouse over any slice, it will give them detail then why have it twice?
- Mark as New
- Bookmark
- Subscribe
- Mute
- Subscribe to RSS Feed
- Permalink
- Report Inappropriate Content
No, not like as shown.
i am talking about legend as shown below, marked by me on left of image. For that legend i need show percentage on left of each OS name in Legend.
- Mark as New
- Bookmark
- Subscribe
- Mute
- Subscribe to RSS Feed
- Permalink
- Report Inappropriate Content
Hi Supriya,
That is not possible in qlik sense. You can show the legend but not with the Values.
If u want to show the do it in backend of the script. Concate with that dimension and call it as dimension in the pie chart.
Thanks,