Unlock a world of possibilities! Login now and discover the exclusive benefits awaiting you.
Search our knowledge base, curated by global Support, for answers ranging from account questions to troubleshooting error messages.
Recent Documents
-
Qlik Cloud App Navigation Showcase
This Techspert Talks session covers: Exploring Cloud Analytics Navigation New developments for better flow Tricks for moving around quicker Chap... Show More -
Where to find and how to download Qlik Sense app demos?
You can access Qlik Sense demo apps from https://demos.qlik.com/. If you are looking for real-life business examples, our Qlik Gallery hosts a platfor... Show MoreYou can access Qlik Sense demo apps from https://demos.qlik.com/.
If you are looking for real-life business examples, our Qlik Gallery hosts a platform meant for sharing apps, outcomes, and ideas. It is not restricted to Qlik-provided demos and mostly consists of customer examples.
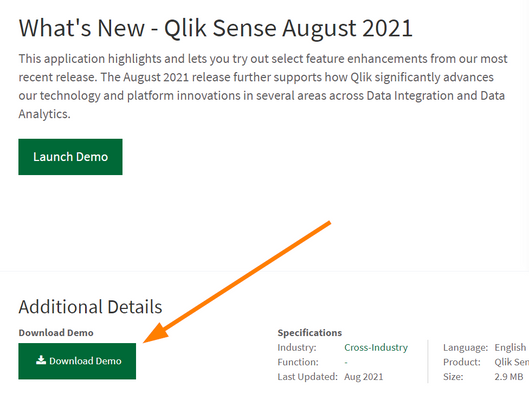
If you are looking to download demo apps:
- Go to https://demos.qlik.com/
- Select Downloadable from the available Tags
- Open the App
- A Download button will be available (if logged in)
-
Qlik Sense Export Limitations and Details
Cannot export an entire table to .pdf Export Data does not equal Export as image, Export as pdf, and Export as ppt (only for stories). Export data i... Show More- Cannot export an entire table to .pdf
- Export Data does not equal Export as image, Export as pdf, and Export as ppt (only for stories). Export data is not managed by Sense Printing but done by the Qlik Sense Engine.
- Export Data allows the export of single visualization, not the entire sheet.
- Export Data export an entire table, not only the selections.
- Export as image/pdf takes a snapshot of each object to be exported (the amount of data exported is the one visible at that moment), renders each visualization in the backend leveraging CEF (Chrome Embedded Framework) and then take a screenshot of the chart
- Export as image/pdf doesn't necessarily reflect what is seen on screen. That means that is not what you see is what you get. The final result is affected by different things like current device (size, resolution,....), final format (A4, A3, letter, etc..), orientation (portrait/landscape), other settings (fit to page/keep current size), the browser you are using, etc....
- Export as image/pdf may fail or generate blank results if a custom theme is in use. Padding, box-shadow and margin elements inside a theme can cause this problem.
-
Advanced options is missing in a Qlik Cloud app
Advanced options is not visible when editing a sheet. This can happen on a specific app even if the option was present before. Resolution You can acti... Show MoreAdvanced options is not visible when editing a sheet. This can happen on a specific app even if the option was present before.
Resolution
You can activate the "Show Sheet Header" option in the app settings to make the "Advanced option" button visible again.
- Open the App settings.
- Activate "Show Sheet Header".
Cause
For some reasons, the "Show Sheet Header" could be deactivated in an app. "Advanced Options" is invisible when this happens, because it is located in the sheet header that is removed. The app looks like this in editing mode:
Environment
- Qlik Cloud
- Open the App settings.
-
Qlik Sense map objects don't export with background map
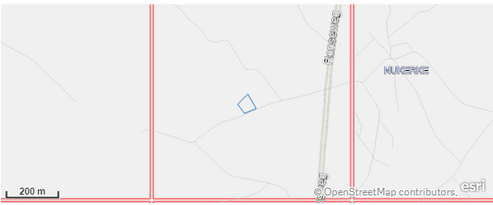
When performing an Export of a Native Map in Qlik Sense only the points are being shown and not the actual background. Current export result (Satellit... Show MoreWhen performing an Export of a Native Map in Qlik Sense only the points are being shown and not the actual background.
Current export result (Satellite background image is missing):
Or the map is entirely blank:
Environment
Resolution
The port 443 to imagery provider services.arcgisonline.com is probably blocked
Check and open port 443 (scroll down to "Web browser ports" and check "map"). -
Qlik Sense Button object background color "none" does not work as expected
Changing the background color of the button object to none results in the button displaying with the default background color (#006580). This is a kno... Show MoreChanging the background color of the button object to none results in the button displaying with the default background color (#006580). This is a known limitation as of today.
Resolution
Qlik is reviewing QB-29806 for future improvements.
Workaround
To achieve transparency (mimicking none as the background color):
- In the button's background option, choose "By Expression"
- Fill in the expression as follows:
ARGB(0,0,0,0)
Cause
This feature predates the introduction of transparency in the colorpicker, meaning it was designed to revert to the default color when none is chosen.
Internal Investigation ID(s)
QB-29806
Environment
- Qlik Sense Enterprise on Windows August 2023 and higher
- Qlik Cloud
-
LogAnalysis App: The Qlik Sense app for troubleshooting Qlik Sense Enterprise on...
It is finally here: The first public iteration of the Log Analysis app. Built with love by Customer First and Support. "With great power comes great r... Show MoreIt is finally here: The first public iteration of the Log Analysis app. Built with love by Customer First and Support.
"With great power comes great responsibility."
Before you get started, a few notes from the author(s):
- It is a work in progress. Since it is primarily used by Support Engineers and other technical staff, usability is not the first priority. Don't judge.
- It is not a Monitoring app. It will scan through every single log file that matches the script criteria and this may be very intensive in a production scenario. The process may also take several hours, depending on how much historical data you load in. Make sure you have enough RAM 🙂
- Not optimised, still very powerful. Feel free to make it faster for your usecase.
- Do not trust chart labels; look at the math/expression if unsure. Most of the chart titles make sense, but some of them won't. This will improve in the future.
- MOD IT! If it doesn't do something you need, build it, then tell us about it! We can add it in.
- Send us your feedback/scenarios!
Chapters:
-
01:23 - Log Collector
-
02:28 - Qlik Sense Services
-
04:17 - How to load data into the app
-
05:42 - Troubleshooting poor response times
-
08:03 - Repository Service Log Level
-
08:35 - Transactions sheet
-
12:44 - Troubleshooting Engine crashes
-
14:00 - Engine Log Level
-
14:47 - QIX Performance sheets
-
17:50 - General Log Investigation
-
20:28 - Where to download the app
-
20:58 - Q&A: Can you see a log message timeline?
-
21:38 - Q&A: Is this app supported?
-
21:51 - Q&A: What apps are there for Cloud?
-
22:25 - Q&A: Are logs collected from all nodes?
-
22:45 - Q&A: Where is the latest version?
-
23:12 - Q&A: Are there NPrinting templates?
-
23:40 - Q&A: Where to download Qlik Sense Desktop?
-
24:20 - Q&A: Are log from Archived folder collected?
-
25:53 - Q&A: User app activity logging?
-
26:07 - Q&A: How to lower log file size?
-
26:42 - Q&A: How does the QRS communicate?
-
28:14 - Q&A: Can this identify a problem chart?
-
28:52 - Q&A: Will this app be in-product?
-
29:28 - Q&A: Do you have to use Desktop?
Environment
Qlik Sense Enterprise on Windows (all modern versions post-Nov 2019)
How to use the app:
- Go to the QMC and download a LogCollector archive or grab one with the LogCollector tool
- Unzip the archive in a location visible to your user profile
- Download the attached QVF file
- Import/open it in Qlik Sense
- Go to "Data Load Editor" and edit the existing "Logs" folder connection, and point to the extracted Log Collector archive path
- If you are using a Qlik Sense server, remember to change the Data Connection name back to default "Logs". Editing via Hub will add your username to the data connection when saved.
- Go to the "Initialize" script section and configure:
- Your desired date range or days to load
- Whether you want the data stored in a QVD
- Which Service logs to load (Repository, Engine, Proxy and Scheduler services are built-in right now, adding other Qlik Sense Enterprise services may cause data load errors).
- LOAD the data!
My workflow:
- I'm looking for a specific point in time where a problem was registered
- I use the time-based bar charts to find problem areas, get a general sense of workload over time
- I use the same time-based charts to narrow in on the problem timestamp
- Use the different dimensions to zoom in and out of time periods, down to a per-call granularity
- Log Details sheets to inspect activity between services and filter until the failure/error is captured
- Create and customise new charts to reveal interesting data points
- Bookmarks for everything!
Notable Sheets & requirements:
- Anything "Thread"-related for analysing Repository Service API call performance, which touches all aspects of the user and governance experience
- Requirement: Repository Trace Performance logs in DEBUG level. Otherwise, some objects may be empty or broken.
- Commands: great for visualizing Repository operations and trends between objects, users, and requests
- Transactions: Repository Service API call performance analysis.
- Requirement: Repository Trace Performance logs in DEBUG level. Otherwise, some objects may be empty or broken.
- Task Transactions: very powerful task scheduling analysis with time-based filters for exclusion.
- Log Details sheets: excellent filtering and searching through massive amounts of logs.
- Repo + Engine data: resource consumption and Thread charts for Repository and Engine services, great for correlating workloads.
*It is best used in an isolated environment or via Qlik Sense Desktop. It can be very RAM and CPU intensive.
The information in this article is provided as-is and to be used at own discretion. Depending on tool(s) used, customization(s), and/or other factors ongoing support on the solution below may not be provided by Qlik Support.
Related Content
Optimizing Performance for Qlik Sense Enterprise - Qlik Community - 1858594
-
Qlik Sense Enterprise on Windows and GeoAnalytics: The visualization was not fou...
Dragging and dropping the Qlik Map object onto a sheet results in the following error: The visualization was not found on the server. This extension i... Show MoreDragging and dropping the Qlik Map object onto a sheet results in the following error:
The visualization was not found on the server. This extension is not available: map ()
Inspecting the error in the browser developer tools (Developer tool console logs) shows the following error:
geo.error.WebmapInvalidkey
Invalid key
Resolution
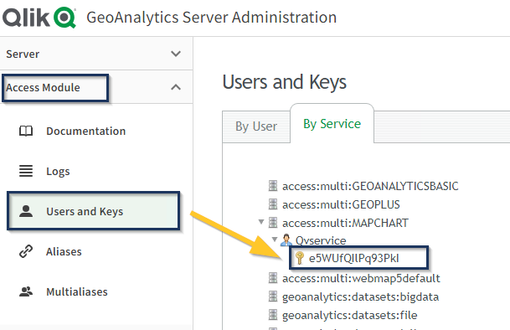
Match the serverKey between Qlik Sense Enterprise on Windows and Qlik GeoAnalytics.
- View the key in GeoAnalytics:
- Open the GeoAnalytics Server Administration console
- Go to Access Module
- Open Users and Keys
- The key is listed in the By Service tab in access:multi:MAPCHART
Expand the service user to reveal it.
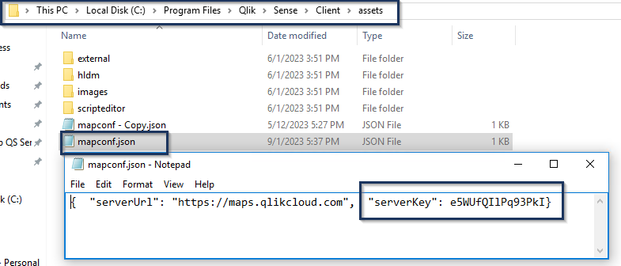
- Review and correct the key in Qlik Sense:
- Navigate to C:\Program Files\Qlik\Sense\Client\assets\
- Open mapconf.json
- Review the value for serverKey:
- Match the value to that of the GeoAnalytics Server
The serverKey value must not be surrounded by quotes (" ").
Optional: If a custom URL is used in the mapconf.json file, match the serverURL value to the custom URL in use. - Save the file
Cause
Qlik Sense Upgrade or Migration. Every time Qlik Sense is upgraded or migrated, the "mapconf.json" file will be overwritten and needs to be updated again.
Related Content
Environment
Qlik Sense Enterprise on Windows
Qlik GeoAnalytics - View the key in GeoAnalytics:
-
Qlik Cloud Analytics: Straight table header text does not wrap correctly
Table header texts are not wrapped automatically when using the straight table from the custom objects. This is a known limitation. Resolution Usage p... Show MoreTable header texts are not wrapped automatically when using the straight table from the custom objects. This is a known limitation.
Resolution
Usage pagination to work around the limitation.
- Switch to Edit sheet mode
- Select the Straight table
- Enable Properties
- Expand Presentation and scroll to Styling
- Toggle on Usage pagination by ticking the checkbox
Fix Version:
The limitation is on the roadmap for review. No date is currently set.
Internal Investigation ID(s):
QB-21283
Environment
-
Exported PDF object blank after upgrade to Qlik Sense Enterprise on Windows May ...
After upgrading to Qlik Sense Enterprise on Windows May 2024 or newer, exporting a sheet or visualization to a PDF leads to a blank PDF output. The sa... Show MoreAfter upgrading to Qlik Sense Enterprise on Windows May 2024 or newer, exporting a sheet or visualization to a PDF leads to a blank PDF output. The same export worked as expected before the upgrade.
This affects deployments running Windows 2012 R2, a version of Windows no longer supported by Qlik Sense Enterprise on Windows. It is incompatible with the current reporting_web_renderer.exe resource used by the Printing service.
Environment
- Qlik Sense Enterprise on Windows May 2024 and newer
- Windows 2012 R2
Resolution
Upgrade the server to a supported operation system and test again.
Cause
Microsoft dropped support for Windows 2012 R2 in January of 2023. The last version of Qlik Sense Enterprise on Windows which supported Windows 2012 R2 was Qlik Sense May 2023.
Related Content
-
NPrinting PDF output report is not displaying characters in local language
Expect font not appearing in NPrinting Pixel Perfect PDF reports. Environment: Qlik NPrinting By Default, there are two fonts that can be selecte... Show MoreExpect font not appearing in NPrinting Pixel Perfect PDF reports.
Environment:
By Default, there are two fonts that can be selected in Pixel Perfect reports that will show the Chinese Characters,
- Arial Unicode MS
- MS Gothic.
Most of the other languages will not show the characters.
In the Pixel Perfect Editor, simply switch to MS Gothic font
Chinese, Japanese ,German, Spanish, Portuguese languages will now appear in the PDF format report export.
-
How to turn use radio buttons (one selected value) in a Filter Pane or List Box
Filter Panes and List Boxes in a Qlik App can be configured as a Radio Button menu, allowing only one value to be selected. Begin editing the sheet w... Show MoreFilter Panes and List Boxes in a Qlik App can be configured as a Radio Button menu, allowing only one value to be selected.
- Begin editing the sheet with your Filter Pane; click Edit Sheet
- Select your Filter Pane, open the Data menu section and click the Field name
- Expand the Presentation menu
- Tick the Checkbox mode option
- Open the Fields menu
- Select the field you are using in your Filter Pane
- Click the Gears, opening the Field Settings
- Tick the Always one selected value checkbox
- You now have a Radio Button menu!
Environment
- Qlik Cloud Analytics
- Qlik Sense Enterprise on Windows
Related Content
- Enabling checkbox mode (help.qlik.com)
-
Qlik Sense Chart-level scripts, ADD LOAD ..... RESIDENT HC1 does not work
The conclusions in this article were reached in collaboration with cjgorrin from the European Commission's Joint Research Centre Qlik Sense team. With... Show MoreThe conclusions in this article were reached in collaboration with cjgorrin from the European Commission's Joint Research Centre Qlik Sense team.
With Qlik Sense's new feature, Chart-level scripts, Add prefix is used with LOAD to append values to the HC1 table, representing the hypercube computed by the Qlik associative engine.
Based on this documentation and using the attached CHART LEVEL SCRIPT_ADD RESIDENT Load.qvf, we would expect the table to have 12 entries (6 original and 6 new)
Example: as the hypercube already has 6 entries, we would expect 6 new entries to be added when using Add prefix.
ADD LOAD
  MyDim1 as MyDim1,
  MyDim2 as MyDim2,
  MyMeasure1*100 as MyMeasure1,
  MyMeasure2*1000 as MyMeasure2
RESIDENT HC1
The result only shows 6 rows, with only one of them being modified:
Resolution
This is working as designed.
ADD LOAD RESIDENT will try to merge duplicate rows and the test cases expect this behavior.
Workaround
To workaround this specific user case, add a blank space to one of the dimensions, as shown below:
ADD LOAD
 MyDim1&' ' as MyDim1,
 MyDim2 as MyDim2,
 MyMeasure1*100 as MyMeasure1,
 MyMeasure2*1000 as MyMeasure2
RESIDENT HC1;"
Internal Investigation ID(s):
QB-27903
Environment
- Qlik Sense May 2024 and above
- Qlik Sense Cloud
-
Qlik Sense Chart-level scripts, PUT DimensionName(r) does not work
The conclusions in this article were reached in collaboration with cjgorrin from the European Commission's Joint Research Centre Qlik Sense team. Base... Show MoreThe conclusions in this article were reached in collaboration with cjgorrin from the European Commission's Joint Research Centre Qlik Sense team.
Based on Qlik Sense online documentation, a PUT statement can be used to access columns, rows i.e. to set a numeric value to the hypercube.
However, using a Dimension name in a PUT statement, the following error is thrown:
Load statement could not find target column [MyDim1] in hypercube
Resolution
This is working as designed.
Put statements are not allowed to manipulate dimensions. The Qlik Sense online help will be updated to reflect this.
Internal Investigation ID(s):
QB-27904
Environment
- Qlik Sense May 2024 and above
- Qlik Sense Cloud
-
Qlik Sense Chart-level scripts, #hc1.dimension.n(rr) silently fails i.e. when PU...
The conclusions in this article were reached in collaboration with cjgorrin from the European Commission's Joint Research Centre Qlik Sense team. Base... Show MoreThe conclusions in this article were reached in collaboration with cjgorrin from the European Commission's Joint Research Centre Qlik Sense team.
Based on Qlik Sense online documentation, PUT statement can be used to set some numeric value to the hypercube
But in the following example (see attached CHART LEVEL SCRIPT_Put Dimension_silently fails.qvf), PUT statement seems to do nothing i.e. when used, no error is returned and expected changes are not displayed
Put #hc1.dimension.1(rr) = 'myvalue_' & rr;
Put #hc1.dimension.2(rr) = rr * 100;
Resolution
This is working as designed.
Put statements are not allowed to manipulate dimensions. The Qlik Sense online help will be updated to reflect this.
Internal Investigation ID(s):
QB-27952
Environment
- Qlik Sense May 2024 and above
- Qlik Sense Cloud
-
How to work with Custom Themes in Qlik Cloud
You can apply styling to customize the app based on your company standards. These styles are managed through custom themes. Important Reading: Stylin... Show MoreYou can apply styling to customize the app based on your company standards. These styles are managed through custom themes.
Important Reading:
To create your own custom theme, you’ll need to compile a compressed zip folder with three key components:
- A definition (QEXT) file
- A main JSON file
- Any additional assets that support the theme as needed (i.e. CSS files)
See Themes overview.
Once you’ve created the theme, you can upload it to your Qlik Cloud Management Console.
- Log on to your Qlik Sense Business or Qlik Sense Enterprise SaaS tenant
- Click your user icon on the top right corner and select Administration
- On the left-hand menu, locate and click Themes
- Click Add
- Upload your theme.
- The theme will now be available for use. Custom themes appear under Custom in the App Theme drop-down menu.
-
Changes to QlikView or Qlik Sense documents may break bookmark functionality
Making changes to a Qlikview document (.qvw) or Qlik Sense app (.qvf) will sometimes break already existing bookmarks. This is sometimes unavoidable a... Show MoreMaking changes to a Qlikview document (.qvw) or Qlik Sense app (.qvf) will sometimes break already existing bookmarks. This is sometimes unavoidable and is a risk developers need to be mindful of when making changes to existing deployments.
Bookmark functionality can be affected by the following changes:
- Removing or renaming fields that are included in the bookmark.
- Changes to the data model or associations between fields.
- Enabling functionality like "Always One Selected" (QlikView) or locked fields, even on fields that are not included in the bookmark!
Making any of these changes can lead to bookmarks that only apply some of the intended selections, or even none at all.
Environment
- QlikView, all versions
- Qlik Sense, all versions, all editions
Resolution
A developer making changes to a document will need to keep these limitations in mind, and test any existing bookmarks, especially after using sensitive functions like "Always One Selected". If a bookmark is discovered to be broken, recreating it after the changes have been made is the best method to get back to a working state.
-
Downloading a sheet to PDF results in a blank PDF with Qlik Sense Enterprise on ...
Downloading a sheet to PDF results in a blank PDF being exported. Environment Qlik Sense Enterprise on Windows February 2024 IR to Patch 6 Resolut... Show MoreDownloading a sheet to PDF results in a blank PDF being exported.
Environment
- Qlik Sense Enterprise on Windows February 2024 IR to Patch 6
Resolution
This was a known defect in February 2024.
Fix Version:
Qlik Sense Enterprise on Windows February 2024 Patch 7 or any later versions, including May 2024.
Cause
Product Defect ID: QB-26818
-
Cells blacked out in Qlik NPrinting report after upgrade
After a Qlik NPrinting upgrade, some cells are blocked out with black color. Example: Resolution This is a known Vizlib extension defect. Verify... Show MoreAfter a Qlik NPrinting upgrade, some cells are blocked out with black color.
Example:
Resolution
This is a known Vizlib extension defect. Verify that a Vizlip extension is in use and contact Vizlib support for further support.
Workaround
Uncheck Keep Source Formatting in the template editor.
Internal Investigation ID(s)
QB-22744
Environment
- Qlik NPrinting
- Vizlib extension
-
Using OData Connector with OData v4.0 JSON Messages with Qlik Web Connectors (Ql...
Qlik Web Connectors support OData v4.0 and responses in JSON format. This article documents a how-to scenario for Qlik Cloud. For an example using t... Show More


