- Subscribe to RSS Feed
- Mark as New
- Mark as Read
- Bookmark
- Subscribe
- Printer Friendly Page
- Report Inappropriate Content
Qlik is committed to making our products available and providing an outstanding user experience to everyone... When technology imitates the diversity of its users, there are no limits to what people can achieve. Qlik Sense has features that enable people who access our products in different ways to more easily interact with data and visualizations.
These features will continue to be developed as we strive to bring analytics and technology to all users with all abilities. Here are some best practices for creating accessible apps.
Building Accessible Apps
Accessibility is more than product features. When building an application, a developer also needs to design with accessibility in mind. This includes principles such as:
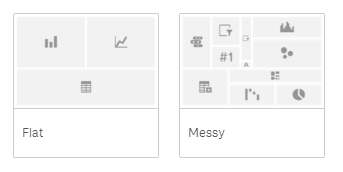
- Keeping a flat structure instead of a complicated grid.
- Providing an overview first, then more detail in subsequent scrollable sheets.
- Using standard colors and a limited palette, choosing for readability.
- Using charts that include the accessible data view
- Providing text descriptions and context as much as possible.
- Limiting values in dimensions to 10 or less.
While it may be more work, your apps will be easier to grasp and use for everyone, not just people with disabilities.
Keep a flat structure
When creating a layout, use a flat and easy structure, with few columns and rows. Complex structures make accessing your app difficult for users with keyboard navigation. Try navigating your sheets with the keyboard and see how users will perceive your app. A flat design also improves sheet readability for all users.
Provide an overview first and the details later
A fundamental design paradigm is “Overview first, details later”. For example, start by providing summaries and KPIs, rather than a complex table. Scrollable sheets let you put more details further down on the page, reducing the number of sheets needed in your app.
Limit colors and choose selectively
Choose colors wisely. Colors can carry important information, but be sure to keep the palette small and distinct. More information on using colors can be found on our Data Visualization Foundations: Color blog post. Sticking to the default colors in Sense is good idea, they provide good readability for users with low vision.
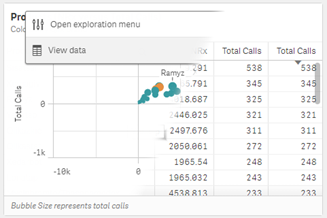
Use charts with a data view
When designing your app, use charts that have the built-in data view. This lets users change the chart to a table, to help inspect and select values. Most of the standard Qlik Sense visualizations include this feature.
Extensions are useful, but you should confirm that they comply with the level of accessibility that you require.
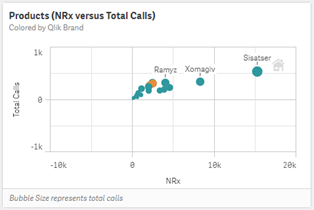
Provide text descriptions
Have you noticed that all visualizations come with fields for a title, a subtitle, and a footer? Providing accurate text descriptions makes life a lot easier for all your users. You might think that your 80-20 bar chart with accumulated sums of sales for current and previous year is self-explanatory. But without context, your users may waste time deciphering your data. Also, screen readers will pick up the descriptions and have them read back.
Limit categories
When working with nominal data, try to find hierarchies or make aggregations if the number of categories is greater than 10. For example, displaying the top 10 values, and rest as ‘Others’ will make your data easier to understand and read aloud. You can always have tables with all the details but be sure put them at the end of the sheet.
Roadmap
Qlik is focused on the development of accessibility features in our products. Additional support for other user roles is on the roadmap. Supporting universal use in our solutions is an evolving process that will continue to employ new technologies and techniques as they become available. Our aim is to expand beyond the existing features within Qlik Sense Enterprise and Qlik Cloud Business.
We've optimized a demo app for your reference that can be found here.
You must be a registered user to add a comment. If you've already registered, sign in. Otherwise, register and sign in.