Unlock a world of possibilities! Login now and discover the exclusive benefits awaiting you.
Recent Documents
-
Digitizing floor plans for use in Qlik GeoAnalytics (QGA)
Update, the example app now have the drawing as a background.Floor plans and cad drawings can be useful, for instance in production dashboards, to vis... Show MoreUpdate, the example app now have the drawing as a background.
Floor plans and cad drawings can be useful, for instance in production dashboards, to visualize status and flows in a factory. However cad drawings are in many cases a mess to work with.
Here's a simple, pragmatic approach to digitize rather than import the actual drawing. The major issue with most CAD drawings is lack of structure, details without meaning and the objects on the right level are missing. It’s not the format or alignment that is the problem. In many cases it's better to use the drawing as a input to produce the polygons and information needed.
In this tutorial I use QGIS for digitizing and out put to a format that is easy to import to QGA. In this example the drawing is digitized in a local reference system, ie no alignment is made with the rest of the world.
Step-by-step guide
- Install QGA basic, Plus not needed if Dropbox et al is used.
- Install QGIS (https://www.qgis.org)
- Get a picture of the floor plan in an image format like PNG or JPG.
- Drag and drop the image to the layers panel of QGIS. Choose a meter based Coordinate Reference System, for instance EPSG:3857 is a good choice.
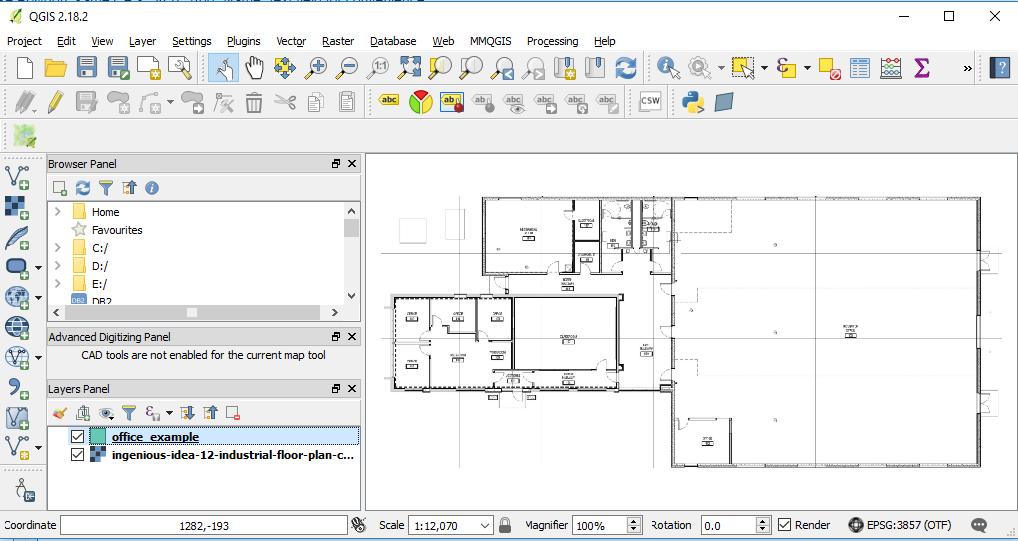
- Layer→ Create Layer→ New Shapefile Layer... Choose Polygon, same CRS, 3857. Add "Name" text field for convenience.

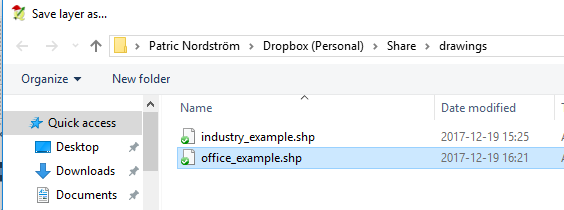
- Save layer in a folder. Preferable in dropbox folder.
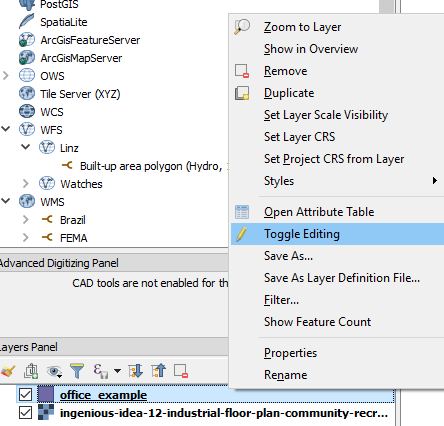
- Right click on the new polygon layer and "Toggle editing" to start editing.
- Start adding features (Ctrl +)
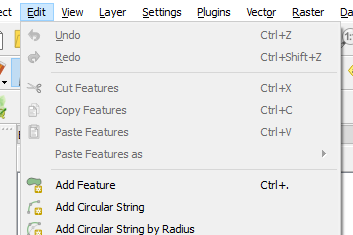
- Click on the edges of the desired polygon, set id and name. Use node tool if fine tuning of edges is necessary.

- When done "Toggle editing"to save.
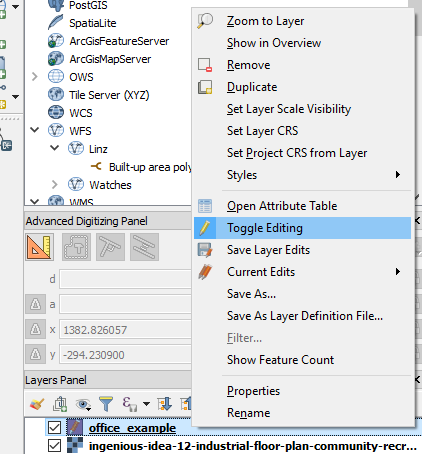
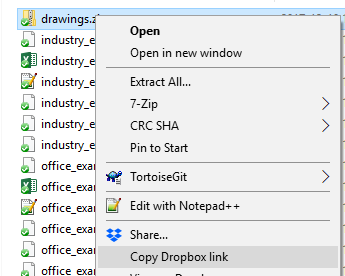
- Zip the shapefile to an archive and get the dropbox url. (replace www with dl to get direct link)
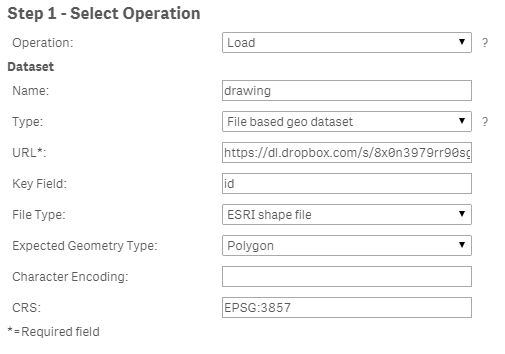
- Create a new Sense app and use the drop url in the Load operator of QGA connector. CRS: EPSG:3857. Note change url from 'www' to 'dl' for direct file access in dropbox.
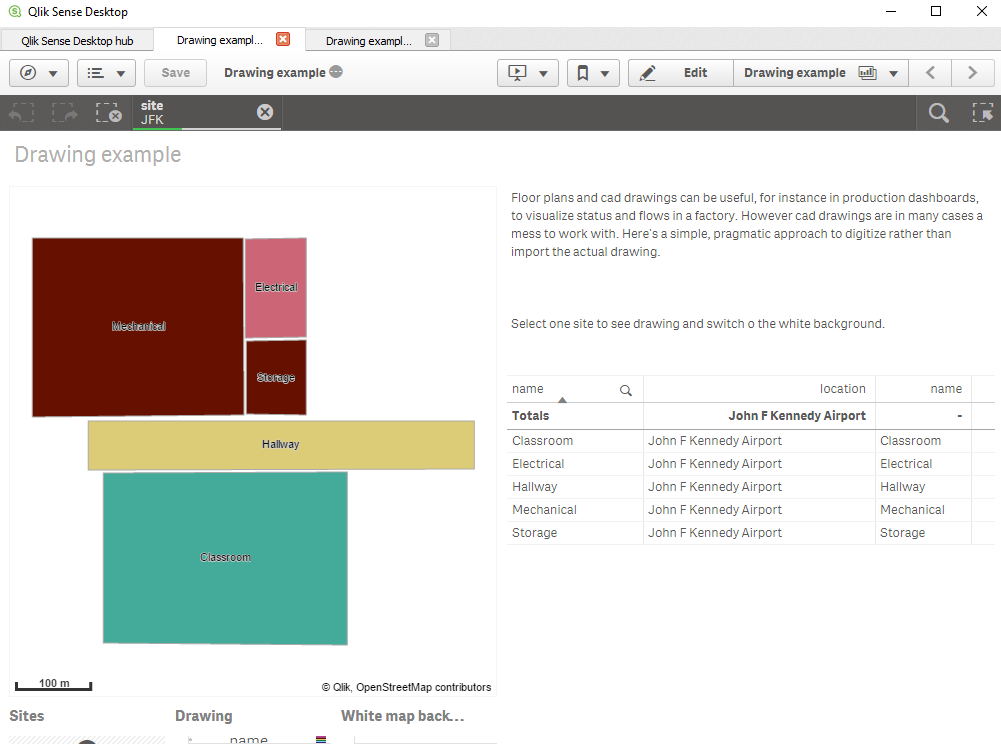
Example app
The example app features sites and a drawing visible when one site is selected.
If you want to add and image background, here's how to scale and translate the image, in my example:
 Tip 1: get a white background use ='[[ [-180, -80], [-180, 80], [ 180, 80], [ 180, -80], [-180, -80] ]]' for location, set color to white and make the layer non selectable and not part of autozoom.
 Tip 2, Use a bubble layer with coordinates for different sites, when one site is selected turn on drawing and the white background.
 -
QlikView Examples Qlik GeoAnalytics
Examples for QlikView with Qlik GeoAnalytics. BinningThis app shows an example of how the Binning feature can be used to create rectangular or hexagon... Show MoreExamples for QlikView with Qlik GeoAnalytics.
Binning
This app shows an example of how the Binning feature can be used to create rectangular or hexagonal bins over Sweden. It also shows a drill-down hierarchy with two levels of rectangular bins and a point level.Chart Layer example
An example of how the Chart Layer can be used to plot data points on graphs (both bars and pies) using two dimensions. This example shows how the average house prices in Sweden have developed over time.Polylines and Symbols example
An example showing how to use the Line Layer to create Polylines and the Bubble Layer to create Symbols from image URLs.Line Layer example – Storms
Example of Line Layer using Storm data to visualize historical storms.EU statistics example
Uses: Bubble Layer with latitude and longitude measures, bubble size and color by measure, Area Layer with location ID for country codes, area color by measure, transparency.Drill down example
A drill down example with three different ways of using drill down data to visualize data. Sheet 1: Drill down based on State - County - Zip Sheet 2: Drill down based on Zip.Heatmap example
Uses: Heatmap Layer, drill down with layers active in different levels, Bubble Layer with visibility restricted to resolution limits.US flight delay example
This example shows how Line Layer, among others, can be used to show routes between different positions and include average departure/arrival delays in the appearance of the lines.The examples requires v 12 or later of QlikView.
-
Loading Esri shapefiles in Qlik GeoAnalytics
It's common that customers keep geodata in shapefiles, here's how to load them in to QlikView and Qlik Sense using Qlik GeoAnalytics.Reading local fil... Show MoreIt's common that customers keep geodata in shapefiles, here's how to load them in to QlikView and Qlik Sense using Qlik GeoAnalytics.
Reading local files requires care, here's a checklist:
File location Use Tip On public url Use Qlik Sense Server/Desktop, Qlik GeoAnalytics connector Check the link provides direct access of the file On laptop harddrive Use Qlik Sense Desktop, Qlik GeoAnalytics connector with Qlik GeoAnalytics Plus Drop the folder in the browser to get the correct syntax: file:/// etc. On Sense server Use Qlik Sense Server, Qlik GeoAnalytics connector with Qlik GeoAnalytics Plus Make sure the file is accessible for the Sense system user. On map server Use Qlik GeoAnalytics Server and Qlik GeoAnalytics connector Verify that the file is accessible for the map server system user. Trick, check with "Add service" file browser under "Service administration" in the server admin tool. Turn on local file access in the map server. Step-by-step guide
First place the shapefile in a zip file. In this example I'm using the Congressional Districts from US Census. A shapefile is actually several files, at least .shp file and .dbf file. Place the zip file on a webserver (Dropbox is handy).
Open the connector and choose "Simplify" (Load can also be used but it's good practice to simplify especially if the shapefile is large (>2MB).
Choose "Auto" for resolution.
Fill in the url: https://www2.census.gov/geo/tiger/TIGER2016/CD/tl_2016_us_cd115.zip or for local files file:///C:/ (Plus required)
A key field is handy but not mandatory, fill in GEOID in this example.
Fill in the CRS: EPSG:4269 (This shapefile is in coordinate system NAD 83, use internet search to find the EPSG code).
Click next, the operation return two tables: one table with index and the simplified geometry and second table with original non-simplified shapes and attributes. Uncheck "Geometry" in the second table if you just want the attributes.
Click Insert script and Load Data
URL
The url must be with direct access to the file. Test by opening the url in a browser, the download should start immediately. Tip, use "dl" instead "www" to get direct access of Dropbox files. Local files
For local zip files in a local file system, QGA Plus or QGA Server is required and use the url syntax file:///C:/Users/bps/Desktop/test.zip. Tip, drag and drop a folder to the browser to get the url. CRS
A tip to find out the coordinate system is to take look inside the .prj file if such exist. Tip, use a search engine for a key word to find the EPSG code. See below for example apps for Qlik Sens and QlikView as well as the shapefile example data.
Please note that when running the QlikView example you need to insert a connection string with the connector.
-
Mapping Postal codes
Mapping data based on postal code areas or center points is a common task. However postal codes is not a one global standard and there is lot of varia... Show MoreMapping data based on postal code areas or center points is a common task. However postal codes is not a one global standard and there is lot of variation between countries in format and structure that makes the task challenging.
Also the availability of postal code areas varies, many countries are included in the Qlik Location database, but for others postal code areas need to be purchased separately.
Workflow
Here's the high level workflow, the bulk is data preparation before rendering
1. Prepare the data
- Make the postal codes unique
- Pad with zeroes
- Some countries are special
- Check coverage
- Build overview layers when possibleThis app will show how to map postal code areas for five European countries: France, Great Britain, Germany and Italy. The indata is not clean and contains errors like in most uses cases.
Prepare the data
Make the postal codes unique
When mapping postal codes for several countries the first step is to make the postal code unique. The easiest way to do this is to add country code prefixed with a comma after the postal code.
=Postal & ',' & CountryCode as zip
Pad with zeroes
In many cases Excel drops leading zeroes in numerical postal codes. I can see that when looking at the max and min lengths. Note that not all postal codes are numeric though and UK is special so we fix that later. Pad with leading zeroes for France, Germany and Italy like this:
=Num(PostalCode,'00000')Great Britain is specialThe postcodes are alphanumeric, and are variable in length: ranging from six to eight characters (including a space) long. Each post code is divided into two parts separated by a single space. More info at Wikipedia. Here's the three levels comparable to 2,3 and 4 digit numeric postal codes:
Area: 1 or 2 lettersDistrict: 1 or 2 digits or a digit followed by a letterSector: 1 digitCan be parsed like this if the the space is in the right place:=If(IsNum(Mid(zip,2,1)),Left(zip,1),Left(zip,2)) & ',' & cc // Area=subfield(zip,' ',1) & ',' & cc // District=subfield(zip,' ',1) & ' ' & left(subfield(zip,' ',2),1) & ',' & cc // SectorCheck coverageBy checking the table at Qlik GeoAnalytics Coverage I can tell that there is built support for postal code areas for most of the countries I am interested. However:(1) Postal code areas are missing for Italy.(2) France doesn't support 2,3,4 level postal code areas.(3) Northern Ireland is not included in the areas for Great Britain.Truncate for 2 and 3 digit postal code levelsGermany and Switzerland are easy, just truncate the zip code and add the country code. Add the following before the load:load *,left(zip,2) & ',' & cc as zip2,left(zip,3) & ',' & cc as zip3;France, IntersectsMostFor France we will use administrative areas level 1 and level 2 as replacement of the non-existing postal code areas of 2 and 3 digit.Using the QGA connector operation IntersectMosts will construct the hierarchy between postal code and admin boundaries: Adm1>Adm2>Zip. For details see the load script.Italy, WithinFor Italy we will also use admin 1 and 2, and use a point layer for the postal code level.Using the QGA connector operation Within we can link postal code center points to the administrative boundary level 2: Adm1>Adm2>Zip. For details see the load script.Create map viewAfter that it's easy to put together a map view.1. Create a drill down group Country > zip2 > zip3 > zip2. Add map chart and a area layer, drill down group as dimension, color by Sum(Sales)3. Add a point layer only visible on level "zip", add a set expression for location: only({<cc={'IT'}>}zip)See the attached app and data for more details. -
Setting up a Esri ArcGIS WFS source as a layer in Qlik GeoAnalytics (QGA)
QGA can consume geodata from many different sources including Esri ArcGIS online, here's what's needed to show the data as a feature layer in QGA. Ste... Show MoreQGA can consume geodata from many different sources including Esri ArcGIS online, here's what's needed to show the data as a feature layer in QGA.
Step-by-step guide
Start by figuring out the correct parameters. In this case the source is administrative boundaries (Buurt) of the Dutch city Zwolle.
- Usually an base url is given like this (https://services1.arcgis.com/3YlK2vfHGZtonb1r/ArcGIS/rest/services/Zwolle_WijkBuurt_gdb/FeatureServer/0), follow and click on "Query" at the bottom
- Set parameters Where 1=1, Outfield BRTNR (this is the field we want to use as index) in, and set the output to geojson and clicked Query (Get)
- Try out the the geojson in geojson.io, realise that projection needs to be 4326 (WGS84), changed the url param : outSR=4326.
Note! If you want to use the builtin basemap, the geojson layer should be in WGS84 -> EPSG:4326 - And voilá a valid geojson url! https://services1.arcgis.com/3YlK2vfHGZtonb1r/ArcGIS/rest/services/Zwolle_WijkBuurt_gdb/FeatureServer/0/query?where=1%3D1&objectIds=&time=&geometry=&geometryType=esriGeometryEnvelope&inSR=&spatialRel=esriSpatialRelIntersects&resultType=none&distance=0.0&units=esriSRUnit_Meter&returnGeodetic=false&outFields=BRTNR&returnGeometry=true&returnCentroid=false&multipatchOption=xyFootprint&maxAllowableOffset=&geometryPrecision=&outSR=4326&returnIdsOnly=false&returnCountOnly=false&returnExtentOnly=false&returnDistinctValues=false&orderByFields=&groupByFieldsForStatistics=&outStatistics=&resultOffset=&resultRecordCount=&returnZ=false&returnM=false&quantizationParameters=&sqlFormat=none&f=pgeojson&token=
- Check that the geojson works by setting it up as a static geodata layer.
- Then make a area layer with the geojson as input, BRTNR as dimension.I checked the geojson and used BRTNR as the "Source key attribute".
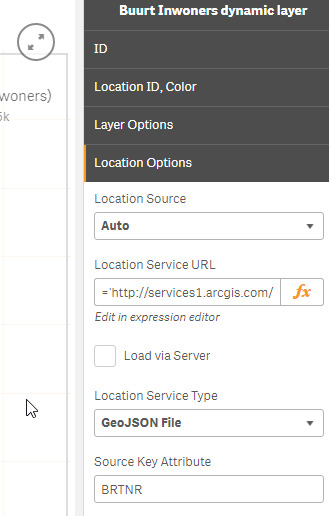
See the attached Sense app for more details. Note 1, this example requires Qlik GeoAnalytics. Note 2, this app features data from an external service which might be out of service.
Authentication in ArcGIS
Special note regarding Authentication in ArcGIS (Thanks to ssamuels for the solution)
The authentication when working with secured map services from ESRI can be solved by setting up a REST connection in the loadscript to retrieve a new access token from the REST API of ArcGIS Online. This is done by sending a GenerateToken request to the URL "https://www.arcgis.com/sharing/generateToken?parameters". The REST call must be a POST request over https and takes the following parameters:
username - Username of the user who wishes to get a token.
password - Password of user who wishes to get a token.
referer - The base URL of the web application that will invoke the services
expiration - The token expiration time in minutes (default value for this parameter is 60 minutes)
f - The response format. The value for this parameter must be "json".
The resulting access token is stored in the data model and can be used as a text variable to append to the location service url in the GeoAnalytics extension.
-
Proxy settings tips for the Qlik GeoAnalytics Connector
The GeoAnalytics connector accesses internet like all connectors through the service user that runs the Qlik Sense or QlikView server. This might comp... Show MoreThe GeoAnalytics connector accesses internet like all connectors through the service user that runs the Qlik Sense or QlikView server. This might complicate things for companies runs a web proxy which requires user authentication.
Note, log on to windows as the service user, that will create a profile used by the web proxy.
To overcome this the connector can be supplied with proxy settings. The connector is a .Net program so the settings are inherited for the .Net framework. Depending on the proxy the following the settings may work. The settings are to be inserted in the settings file at C:\Program Files\Common Files\Qlik\Custom Data\QvIdevioConnector\IdevioGeoAnalyticsConnector.exe.config path may vary due to how the installation was done (default folders). The settings are to be inserted in the end, in the <configuration> tag.
Ex 1: Tells the connector to use default credentials:
<system.net>
<defaultProxy useDefaultCredentials="true" />
</system.net>
Ex 2: Add server to bypasslist (string is regexp):
<system.net>
<defaultProxy useDefaultCredentials="true" enabled="true" >
<bypasslist>
<add address="https:\/\/ga\.qlikcloud\.com" />
</bypasslist>
</defaultProxy>
</system.net>
Ex 3: To specify the proxy explicitly:
<system.net>
<defaultProxy useDefaultCredentials="true" enabled="true">
<proxy usesystemdefault="False" autoDetect="False" proxyaddress="http://proxy:8080" />
</defaultProxy>
</system.net>
For more information about proxy settings for .Net:
-
Connector Examples Qlik GeoAnalytics
Examples and guides for the Qlik GeoAnalytics Connector operations. The examples are self sufficient with data and reloadable. The examples are minima... Show MoreExamples and guides for the Qlik GeoAnalytics Connector operations. The examples are self sufficient with data and reloadable. The examples are minimal to explain to basic functionality. Please use the documentation for details of the operations.
Although the examples are made with Qlik Sense the load script code will work in QlikView too. The following operations are covered
- AddressPointLookup (Separate license required, Qlik Geocoding)
- Binning
- Closest
- Cluster Guide
- Dissolve Guide
- Intersects
- IntersectsMost
- IpLookup
- Load
- NamedAreaLookup
- NamedPointLookup
- PointToAddressLookup (Separate license required, Qlik Geocoding)
- Routes
- Simplify
- SpatialIndex
- TravelAreas
- Within
Edit, the examples have been updated to use map chart.
-
Image to Map
This guide describes how to convert an arbitrary image to a clickable map. I use it for drawings and sketches, for floor plans I often use another app... Show MoreThis guide describes how to convert an arbitrary image to a clickable map. I use it for drawings and sketches, for floor plans I often use another approach, see this article.
Here's the high level workflow, using Qlik Sense, Qlik GeoAnalytics and open source tools:
- Find a suitable image, the hardest part by far.
- Bucket fill areas, I prefer Inkscape.
- Vectorize and Simplify, QGIS is useful.
- Load into Sense.
- Done!
See below attachments for a step by step guide and some example files. The final result can be used in the native Sense map chart as well as in the map of Qlik GeoAnalytics for Sense and QlikView.
-
Qlik Sense Examples Qlik GeoAnalytics
Qlik Sense Examples Qlik GeoAnalyticsEdit, apps have been updated to use the map chart for most examples.Store Site Selection demoThis app shows the c... Show MoreQlik Sense Examples Qlik GeoAnalytics
Edit, apps have been updated to use the map chart for most examples.
Store Site Selection demo
This app shows the customer distribution for a chain of stores. Contains customer behavior analysis, drive time calculations and what if analysis of new stores.
Tesla Supercharger Coverage
Coverage of Tesla supercharger stations in the worls. Calculations on actual road network and estimation of average battery range. Source: supercharge.info
Routing Danish Cities
An example showing routes between different cities. Show cases GeoAnalytics routing capabilities.
London Fire Brigade
London Fire Brigade incident and response time analysis.
Barcelona Traffic
Traffic analysis in Barcelona
Sales Location Analysis
Investigates locations of sales offices based on population living within 30 min drive time and overlap of uptake areas between sales offices. Uses GeoAnalytics TravelArea and Intersects operations.
Select Visible example
Shows how browsing large point data sets is made possible with the Select Visible feature.
Symbols in Bubble Layer
This app demonstrates an example of how Symbols can be used in the bubble layer. Most normal image formats can be used as symbols.
Chart Layer example
An example of how the Chart Layer can be used to plot data points on graphs (both bars and pies) using two dimensions. This example shows how the average house prices in Sweden have developed over time.
Line Layer example – Storms
Example of Line Layer using Storm data to visualize historical storms.
Heatmap example
Uses: Heatmap Layer, drill down with layers active in different levels, Bubble Layer with visibility restricted to resolution limits.
Drill down example
A drill down example with three different ways of using drill down data to visualize data. Sheet 1: Drill down based on State - County - Zip Sheet 2: Drill down based on Zip
US flight delay example
Uses: Bubble Layer with location ID for airport codes, Line Layer with location ID, line width and line color by measure, line arrows, Area Layer with location ID, select in map layer.
EU statistics example
Uses: Bubble Layer with latitude and longitude measures, bubble size and color by measure, Area Layer with location ID for country codes, area color by measure, transparency. -
A GeoAnalytics [extensive] Enablement
Through time, I have been delivering a few GeoAnalytics enablement sessions. Some with more in depth exercises than others. I've compiled a PDF with ... Show More -
Custom labels and dynamic symbols in Qlik GeoAnalytics using data URIs
In the current version of Qlik GeoAnalytics there are limitations in the styling of labels and storage location of symbols to the bubble layer. Using ... Show MoreIn the current version of Qlik GeoAnalytics there are limitations in the styling of labels and storage location of symbols to the bubble layer. Using data URIs with inline image files of PNG or SVG is neat workaround that works fine. The inline SVG can be produced on the fly with a Qlik expression which opens up a lot of possibilities, some use cases listed below. There are also some caveats which are listed in the end together with links to more information.

Tip! Test the data URI directly in the browser, paste the URI in the browser (won't work in IE) bar
Encoding
Data URIs must be in either in Base64 encoding or URL safe ANSI ASCII. Since Qlik don't have URL or Base64 encoding built in we can use translation tables, online tools or for instance Notepad++ to do the conversion. Base64 is suitable for images and content that don't need to change dynamically. URL encoding is good for dynamic SVG where we want to change the appearance of the icon or the symbol with Qlik expressions. Options:
- Base64 conversion with external tool
- URL encode with external tool
- URL encode with translation table
- URL encode with expression
- Or to combine 2,3 and 4
(3) Translation table example, useful for conversion of static content at load time. Here's an example with Western symbols, other tables can be found for other character sets. Note the use of MapSubstring.
URL_Encoding_Reference:
Mapping LOAD
Replace([Character], 'space', ' ') as ASCII_Character,
Text([From UTF-8]) as URL_encoding
FROM
[http://www.w3schools.com/tags/ref_urlencode.asp]
(html, utf8, embedded labels, table is @1);
// Sites addresses
sites:
Load *,
MapSubstring('URL_Encoding_Reference', address) as encoded_address;
LOAD
site,
name,
address,
s_abbrev
FROM [lib://AssaAbloy/sites.csv]
(txt, utf8, embedded labels, delimiter is ';');
(4) Translation expression, note that it's not complete, it's a list common symbols, useful for translations in runtime. More symbols needs to be escaped to become URL safe, especially when working with UTF-8 characters.
set v_uuenc =
replace(replace(replace(replace(replace(replace(replace(replace(replace(replace(
replace(replace(replace(replace(replace(replace(replace(replace(replace($1
,'%', '%25')
,' ', '%20')
,'#', '%23')
,'{', '%7B')
,'}', '%7D')
,'<', '%3C')
,'>', '%3E')
,'&', '%26')
,'|', '%7C')
,'[', '%5B')
,']', '%5D')
,'^', '%5E')
,'`', '%60')
,';', '%3B')
,'?', '%3F')
,':', '%3A')
,'@', '%40')
,'=', '%3D')
,'"','''');
Storing images in the app
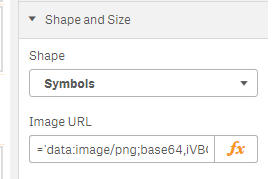
The bubble layer requires all symbols to be reachable by URL from the map server. But a data URI can be used instead, use an external tool to do the conversion. After that store the data URI in a string and place in the 'Image URL' in the bubble layer properties.
Styling labels
Labels has fixed font, size and color in QGA, a SVG symbol with text can be used to overcome that.
- In SVG standard coordinate system y axis is point downwards.
- The bubble layer centers the symbol on the point location.
- SVG uses CSS colors.
- Font type, weight and size can be specified.
Here's an SVG that set font and color and size for a single row label:
data:image/svg+xml,<svg xmlns="http://www.w3.org/2000/svg" height="200" width="200"><text text-anchor="start" font-family="Verdana" font-weight="700" font-size="14" fill="red"><tspan x="102" y="130">Red Label</tspan></text></svg>
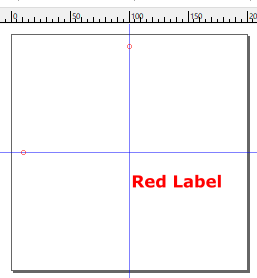
(Guides and border added for clarity)
When properly URL safe encoded and put in QV expression the data URI looks like this, note how the label text is inserted in to the expression. The URL encoding was done with Notepad++ and the MIME tool plugin, there are also online encoders.
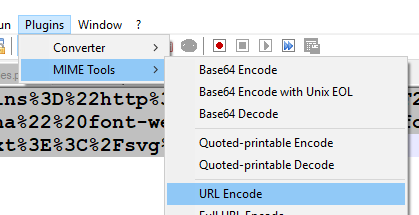
='data:image/svg+xml,%3Csvg%20xmlns%3D%22http%3A%2F%2Fwww.w3.org%2F2000%2Fsvg%22%20height%3D%22200%22%20width%3D%22200%22%3E%3Ctext%20text-anchor%3D%22start%22%20font-family%3D%22Verdana%22%20font-weight%3D%22700%22%20font-size%3D%2214%22%20fill%3D%22red%22%3E%3Ctspan%20x%3D%22102%22%20y%3D%22130%22%3E' &
encode(airport_Name) &
'%3C%2Ftspan%3E%3C%2Ftext%3E%3C%2Fsvg%3E'
Multi line labels
Similar as the previous example, but with two rows in the label:
data:image/svg+xml,<svg xmlns="http://www.w3.org/2000/svg" height="200" width="400"><text text-anchor="start" font-family="Verdana" font-weight="700" font-size="14" fill="blue"><tspan x="202" y="120">Label 1</tspan><tspan x="202" y="140">Label 2</tspan></text></svg>
Caveats
Data URI
- All characters must be URL safe. All characters must be in ANSI ASCII
- Make the custom symbol label an additional point layer, non-selectable.
Links to more information and useful resources
- data: URI Generator, to convert an image to base64 data URI
- URL encoder online, to make svg text URL safe
- Optimizing SVGs in data URIs, article on using SVG files
- SVG basic configuration
- SVG text tag definition
- URL Encoding Reference, Western
- URL Ecoding table, Hebrew
Example app with inline SVG, PNG and multiline, styled labels below:
-
Default folders, paths, urls and ports in Qlik GeoAnalytics
Default folders and paths for different installation, can be changed during installation. Qlik GeoAnalytics Clients Qlik Sense Desktop Extension... Show MoreDefault folders and paths for different installation, can be changed during installation.
Qlik GeoAnalytics Clients
Qlik Sense Desktop
Extension folder: C:\Users\<user>\Documents\Qlik\Sense\Extensions\
Connector folder: C:\Program Files\Common Files\Qlik\Custom Data\QvIdevioConnector
Connector log: C:\ProgramData\QlikTech\Custom Data\IdevioGeoAnalyticsConnector\Log
Qlik Sense Server
Extension folder: C:\ProgramData\Qlik\Sense\Repository\Extensions\ (Shared persistance->under c:\QlikShare)
Connector folder: C:\Program Files\Common Files\Qlik\Custom Data\QvIdevioConnector
Connector log: C:\ProgramData\QlikTech\Custom Data\IdevioGeoAnalyticsConnector\Log
QlikView Desktop
Extension folder: C:\Users\<user>\AppData\Local\QlikTech\QlikView\Extensions\Objects\
Connector folder: C:\Program Files\Common Files\QlikTech\Custom Data\QvIdevioConnector
Connector log: C:\ProgramData\QlikTech\Custom Data\IdevioGeoAnalyticsConnector\Log
QlikView Server
Extension folder: C:\ProgramData\QlikTech\QlikViewServer\Extensions\Objects\
Connector folder: C:\Program Files\Common Files\QlikTech\Custom Data\QvIdevioConnector
Connector log: C:\ProgramData\QlikTech\Custom Data\IdevioGeoAnalyticsConnector\Log
 Shared Persistence
Since the Engine loads connectors (and DSNs) from local resources, it is important to install the GeoAnalytics connector to all nodes with an Engine service active or the GeoAnalytics Connector may not function properly.
Qlik GeoAnalytics Plus
Home:
C:\Program Files\Common Files\QlikTech\Custom Data\QvIdevioConnector (QV)
C:\Program Files\Common Files\Qlik\Custom Data\QvIdevioConnector (Sense)Logs: C:\Users\<username>\AppData\Roaming\GeoAnalyticsPlus\logs\GeoAnalyticsPlus.log
Checks license at https://floatinglicenses.qlikcloud.com
Qlik GeoAnalytics Server
Home: C:\ProgramData\Qlik GeoAnalytics Server\server3\
Logs: C:\ProgramData\Qlik GeoAnalytics Server\server3\logs.
Port 80 for http and port 443 for https, can be changed during installation.
URLs
The following urls are needed, QGA Extensions: https://maps.qlikcloud.com
License activation, ports 80 and 4747 to lef1|2|3.qliktech.com,
QGA Server can be activated without internet connection.
The QGA connector: https://ga.qlikcloud.com
QGA Plus: https://route.qlikcloud.com, https://geocode.qlikcloud.com, https://floatinglicenses.qlikcloud.com
Note! The connection for the extensions are from the client web browser to the map server. The connection from the QGA connector are from the Sense server (like all connectors) to the map server.
-
Setting up a TMS as a background map in Qlik GeoAnalytics
QGA can consume geodata from many different sources, here's what's needed to use a TMS a background map in QGA.Sense Map chartStart with specifying th... Show MoreQGA can consume geodata from many different sources, here's what's needed to use a TMS a background map in QGA.
Sense Map chart
Start with specifying the source. In this case the source is a TMS from ArcGIS Online: World_Topo_Map.
- The TMS service is specified as a url with parameters for X, Y as Z, which specifies the position of the map image and the scale level. At ArcGIS Online the start tile is defined as: https://services.arcgisonline.com/arcgis/rest/services/World_Topo_Map/MapServer/tile/0/0/0 with z, y, x as the order of the last parameters.
- Exchange the last part of the parameters and format as a string, this is the Tile Service URL:
='http://server.arcgisonline.com/arcgis/rest/services/World_Topo_Map/MapServer/tile/${z}/${y}/${x}' - Create a map and add a Background layer
- For the Background layer specify the URL.
- Don't forget to include the copyright text in the attribution:
Sources: Esri, HERE, DeLorme, Intermap, increment P Corp., GEBCO, USGS, FAO, NPS, NRCAN, GeoBase, IGN, Kadaster NL, Ordnance Survey, Esri Japan, METI, Esri China (Hong Kong), swisstopo, MapmyIndia, © OpenStreetMap contributors, and the GIS User Community
Old QGA Map extensions
Start with specifying the source. In this case the source is a TMS from ArcGIS Online: World_Topo_Map.
- The TMS service is specified as a url with parameters for X, Y as Z, which specifies the position of the map image and the scale level. At ArcGIS Online the start tile is defined as: https://services.arcgisonline.com/arcgis/rest/services/World_Topo_Map/MapServer/tile/0/0/0 with z, y, x as the order of the last parameters.
- Exchange the last part of the parameters and format as a string, this is the Tile Service URL:
='http://server.arcgisonline.com/arcgis/rest/services/World_Topo_Map/MapServer/tile/{z}/{y}/{x}' - Create a map view and a geodata layer
- For the geodata layer specify the Tile Service URL and Source format: TMS and Tile Size: 256.
- Don't forget to include the copyright text some where in the app, in this case the attribution should be:
Sources: Esri, HERE, DeLorme, Intermap, increment P Corp., GEBCO, USGS, FAO, NPS, NRCAN, GeoBase, IGN, Kadaster NL, Ordnance Survey, Esri Japan, METI, Esri China (Hong Kong), swisstopo, MapmyIndia, © OpenStreetMap contributors, and the GIS User Community
See also the two attachments, example apps for Qlik Sense and QlikView.¨
Authentication in ArcGIS
Special note regarding Authentication in ArcGIS (Thanks to ssamuels for the solution)
The authentication when working with secured map services from ESRI can be solved by setting up a REST connection in the loadscript to retrieve a new access token from the REST API of ArcGIS Online. This is done by sending a GenerateToken request to the URL "https://www.arcgis.com/sharing/generateToken?parameters". The REST call must be a POST request over https and takes the following parameters:
username - Username of the user who wishes to get a token.
password - Password of user who wishes to get a token.
referer - The base URL of the web application that will invoke the services
expiration - The token expiration time in minutes (default value for this parameter is 60 minutes)
f - The response format. The value for this parameter must be "json".
The resulting access token is stored in the data model and can be used as a text variable to append to the location service url in the GeoAnalytics extension.
-
GeoAnalytics for QV tutorial, TravelAreas, Closest, Dissolve
This guide has been used for customers that have had an interest in getting to learn Qlik GeoAnalytics for QlikView. It is a step by step guide introd... Show MoreThis guide has been used for customers that have had an interest in getting to learn Qlik GeoAnalytics for QlikView. It is a step by step guide introducing the layer concept and also introducing the GeoAnalytics Connector by using it in some real examples.
Table of Content
1. Introduction
2. Exercise 1
Create a new QlikView app
Start using the GeoAnalytics Extensions
Map-, Bubble- and Area-layer
- Add a Chart layer
- Add a Heatmap layer
- Add a Geodata layer
3. Exercise 2
- QGA Connector operation “Closest”
- Add a Map-, Line and two Bubble-layers
- Add Travel Areas with the QGA Connector
4. Dissolve countries into continents
- Use the Dissolve Operation
- Create a Drill-down
- Add an Area layer
Material includes:
- QGAGettingStartedGuide.pdf
- Data for the exercises
countryxcontinent.xlsx
gettingstarteddata.xlsx
USACities.qvd - 2 applications with the result of the exercises
country_continent.qvw
gettingstarted_Ex1_Ex2.qvw
-
Native mapchart settings
Connecting map chart with an on premise Qlik GeoAnalytics Server From Qlik Sense April 2018, the built-in Map chart can be used with GeoAnalytics Serv... Show MoreConnecting map chart with an on premise Qlik GeoAnalytics Server
From Qlik Sense April 2018, the built-in Map chart can be used with GeoAnalytics Server in an on-premise solution. For this GeoAnalytics Data Package 18.04 or newer is needed.
First, install the data package according the guide including the optional step named "Enable support for Qlik Sense Map" or similar.
Then go to your Qlik Sense installation and point the Sense map to the server by editing the file mapconf.json in C:\Program Files\Qlik\Sense\Client\assets (or similar) and set the URL to the server in the serverUrl property and the key you have chosen during data package installation for Sense map users in serverKey.
Example:
{
"serverUrl":"https://mysite.com",
"serverKey":"abcdefg"
}Note that every time Qlik Sense is upgraded this file will be overwritten, so it will need to be edited again.
Custom default map background
For all new map charts per site. Edit Qlik\Sense\Client\assets\mapconf.json
Set alternative basemap:
"defaultMap":"pale_mercator" (list of of possible values below)
Set any TMS:
"defaultMap":"http://tile.openstreetmap.org/${z}/${x}/${y}.png"
Set attribution:
"defaultAttribution":"copyright me"Full nameMapProjectiondefault Default Mercator default_adaptive Default Adaptive pale_mercator Pale Mercator pale_adaptive Pale Adaptive satellite_mercator Satellite Mercator empty None Undefined degrees emptymeters None Undefined meters emptydegreemercator None Mercator


