- Mark as New
- Bookmark
- Subscribe
- Mute
- Subscribe to RSS Feed
- Permalink
- Report Inappropriate Content
Create Pareto Chart for Sales analysis
Hi Guys,
Need help to creat pareto chart for sales analysis.
Please see the qvw attached. I am trying to split the axes in order to show sales amount in left side, and accumulative percent in right side.
What's missing?
Thanks in advance,
Aldo.
Accepted Solutions
- Mark as New
- Bookmark
- Subscribe
- Mute
- Subscribe to RSS Feed
- Permalink
- Report Inappropriate Content
Hi Aldo,
Not sure i understood your question properly.
I have changed the "Position" of the 2nd expression "Accumulated sales" to "Right" in Presentation tab which you`ll find in position frame.
Look at the attached application.
Hope this helps you.
- Sridhar
- Mark as New
- Bookmark
- Subscribe
- Mute
- Subscribe to RSS Feed
- Permalink
- Report Inappropriate Content
Hi Aldo,
According to the help, I think spilt axis affects the y-axis and not the x-axis.
I got a split, but that's probably not what you want.
What do you want to show in detail?
Stefan
- Mark as New
- Bookmark
- Subscribe
- Mute
- Subscribe to RSS Feed
- Permalink
- Report Inappropriate Content
Hi Aldo,
Not sure i understood your question properly.
I have changed the "Position" of the 2nd expression "Accumulated sales" to "Right" in Presentation tab which you`ll find in position frame.
Look at the attached application.
Hope this helps you.
- Sridhar
- Mark as New
- Bookmark
- Subscribe
- Mute
- Subscribe to RSS Feed
- Permalink
- Report Inappropriate Content
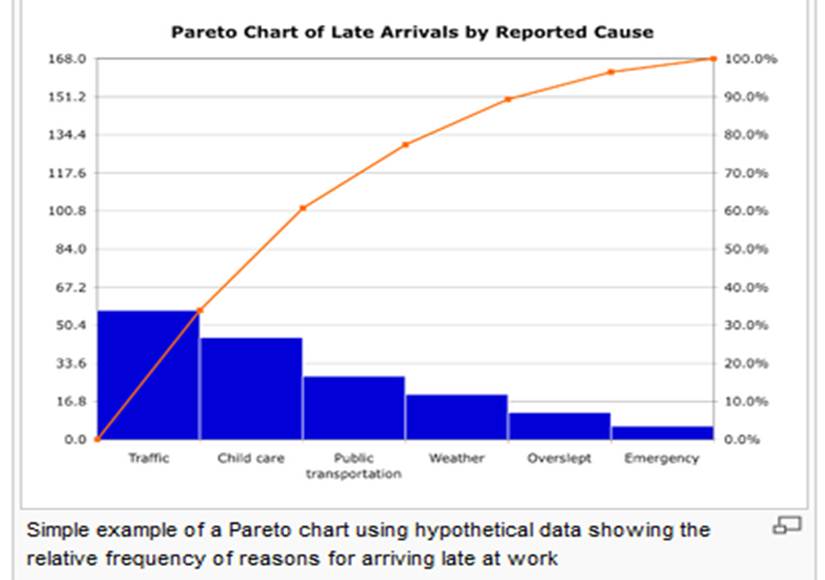
Hi Stefan,
I need to split y-axis indeed.
Below an example.
Thanks,
Aldo.
- Mark as New
- Bookmark
- Subscribe
- Mute
- Subscribe to RSS Feed
- Permalink
- Report Inappropriate Content
Hi Sridhar,
That's exacly what I was looking for.
I noted you didn't used split axes, and instead just set first expression to left side, second to right one... that's a bit confusing because I thought I need to split the axis (it sounds logical...)
Thanks,
Aldo.
- Mark as New
- Bookmark
- Subscribe
- Mute
- Subscribe to RSS Feed
- Permalink
- Report Inappropriate Content
Hi All,
Is there a way to draw a straight line at 80% in the given chart?
Thanks,
Nihar
- Mark as New
- Bookmark
- Subscribe
- Mute
- Subscribe to RSS Feed
- Permalink
- Report Inappropriate Content
Nihar,
Here is a pretty basic example: http://www.quickqlearqool.nl/?p=1086
- Mark as New
- Bookmark
- Subscribe
- Mute
- Subscribe to RSS Feed
- Permalink
- Report Inappropriate Content