Unlock a world of possibilities! Login now and discover the exclusive benefits awaiting you.
- Qlik Community
- :
- All Forums
- :
- QlikView App Dev
- :
- Re: Curves graphism problem
- Subscribe to RSS Feed
- Mark Topic as New
- Mark Topic as Read
- Float this Topic for Current User
- Bookmark
- Subscribe
- Mute
- Printer Friendly Page
- Mark as New
- Bookmark
- Subscribe
- Mute
- Subscribe to RSS Feed
- Permalink
- Report Inappropriate Content
Curves graphism problem
Hello everybody,
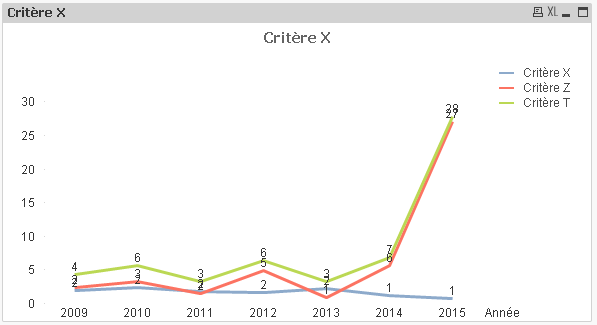
I have a litle problem with curves graph
I have 3 expression into this curves.
Problem : i get 3 separate Y values, i want to have for example at x= 2015 the "critèere Z" curve near "critère T" because there is juste "1" betwenn them (28 - 27 =1 )
Hope you understand what i'm tryng to do, i'lll join a sample qvw.
Thanks
- Mark as New
- Bookmark
- Subscribe
- Mute
- Subscribe to RSS Feed
- Permalink
- Report Inappropriate Content
Hi,
I think you could change Look style in Style Tab to solve tyour issue.
Regards
- Mark as New
- Bookmark
- Subscribe
- Mute
- Subscribe to RSS Feed
- Permalink
- Report Inappropriate Content
OK, im trying to, but dont see where to do that, can you make it with the qvw file joined?
- Mark as New
- Bookmark
- Subscribe
- Mute
- Subscribe to RSS Feed
- Permalink
- Report Inappropriate Content
Hi,
The first option will show the real values.
![2015-06-22 11_04_27-Chart Properties [Critère X].png](/legacyfs/online/90247_2015-06-22 11_04_27-Chart Properties [Critère X].png)

- Mark as New
- Bookmark
- Subscribe
- Mute
- Subscribe to RSS Feed
- Permalink
- Report Inappropriate Content
thanks for the helps,
but in fact i dont want to change curves style, but to get this result with my current style, u understant more now?
Thanks
- Mark as New
- Bookmark
- Subscribe
- Mute
- Subscribe to RSS Feed
- Permalink
- Report Inappropriate Content
Hi
Please check attached modified qvw.
Please be aware that for 2013 the values not correct because Z value is less than X value.
Maybe you can use an if-statement to fix the issue. For details see the expression tab.
I hope this will help you to achieve what you want.
Regards,
Ronny
- Mark as New
- Bookmark
- Subscribe
- Mute
- Subscribe to RSS Feed
- Permalink
- Report Inappropriate Content
Thanks a lot Ronny,
your solution is excellent, now i try to do with my real qvw, what i have to do to have all the Y values down?
Can you explain step by step, what you did and why, so i can understand deeply.
Thanks
- Mark as New
- Bookmark
- Subscribe
- Mute
- Subscribe to RSS Feed
- Permalink
- Report Inappropriate Content
Hi,
just look inside the chart properties to see all changes.
I used one value as base (X) and than calculate the differences.
Line Z is Sum(Z-X) & Line T is Sum(T-Z-X). As long as there is a positive difference it is working fine but for 2013 you have a negative difference between X and Z which return wrong results for Z & T, compared to your data.
The problem is now how this case should be displayed !
I think an if statement could solve this. I will check later if I can find a proper solution.
Regards,
Ronny