Unlock a world of possibilities! Login now and discover the exclusive benefits awaiting you.
- Qlik Community
- :
- All Forums
- :
- QlikView App Dev
- :
- Integrating a checkbox in a chart
- Subscribe to RSS Feed
- Mark Topic as New
- Mark Topic as Read
- Float this Topic for Current User
- Bookmark
- Subscribe
- Mute
- Printer Friendly Page
- Mark as New
- Bookmark
- Subscribe
- Mute
- Subscribe to RSS Feed
- Permalink
- Report Inappropriate Content
Integrating a checkbox in a chart
Hi,
I'd like to know if there is any ways of achiving this need.
I have a chart with dimensions and expressions:
| Dim1 | Dim2 | Dim3 | Duration (expression) |
|---|---|---|---|
| Ticket 1 | Application A | Site 1 | 00:10 |
| Ticket 2 | Application B | Site 1 | 04:05 |
| Ticket 3 | Application C | Site 2 | 00:30 |
This chart helps me to identify which tickets i want to keep in my active selection
that's why i would like to integrate in a column a windows style checkbox
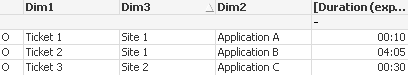
| Dim1 | Dim2 | Dim3 | Duration (expression) | |
|---|---|---|---|---|
| O | Ticket 1 | Application A | Site 1 | 00:10 |
| O | Ticket 2 | Application B | Site 1 | 04:05 |
| O | Ticket 3 | Application C | Site 2 | 00:30 |
I know the listbox item has that feature but is it possible with chart items (I need to calculate things and filter using set analysis).
Any idea ? Thanks in advance
- Mark as New
- Bookmark
- Subscribe
- Mute
- Subscribe to RSS Feed
- Permalink
- Report Inappropriate Content
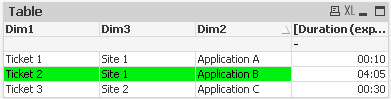
Getting the checkbox is not the problem:
Just add a dimension with a fixed value of "O" 
But what would you like to happen when you click a checkbox? E.g. if you check the second line, would that result in a selection of Ticket 2, Site 1 and Application B?
If so, why limit the user with a checkbox, just let them select the dimensions they want to use in de table.
- Mark as New
- Bookmark
- Subscribe
- Mute
- Subscribe to RSS Feed
- Permalink
- Report Inappropriate Content
It's a kid of shopping list of the data i wan't to use for other reports.
This list gives me calculted informations that allows me to decide wether or not they have to be in my reporting.
As i cannot ctrl+click to select multiple items in a chart object, i want to add a checkbox in each line to tell if i need to have them.
The listbox object is ok to do that but I cannot use set analysis to restrict data that is in.