Unlock a world of possibilities! Login now and discover the exclusive benefits awaiting you.
- Qlik Community
- :
- All Forums
- :
- QlikView App Dev
- :
- Show date range above report in text field
- Subscribe to RSS Feed
- Mark Topic as New
- Mark Topic as Read
- Float this Topic for Current User
- Bookmark
- Subscribe
- Mute
- Printer Friendly Page
- Mark as New
- Bookmark
- Subscribe
- Mute
- Subscribe to RSS Feed
- Permalink
- Report Inappropriate Content
Show date range above report in text field
Hi community,
I have been searching for this (probably easy) a long time, but didn't find it. What I need is the code to place in a Text Object (or above graphs for example).
Now the catch is this: I have a date range. So I could say: Min and Max but when I make a selection in the graph it should automatically adjust the range to correspond with the date range from the selection.
So without a selection it is all fine:
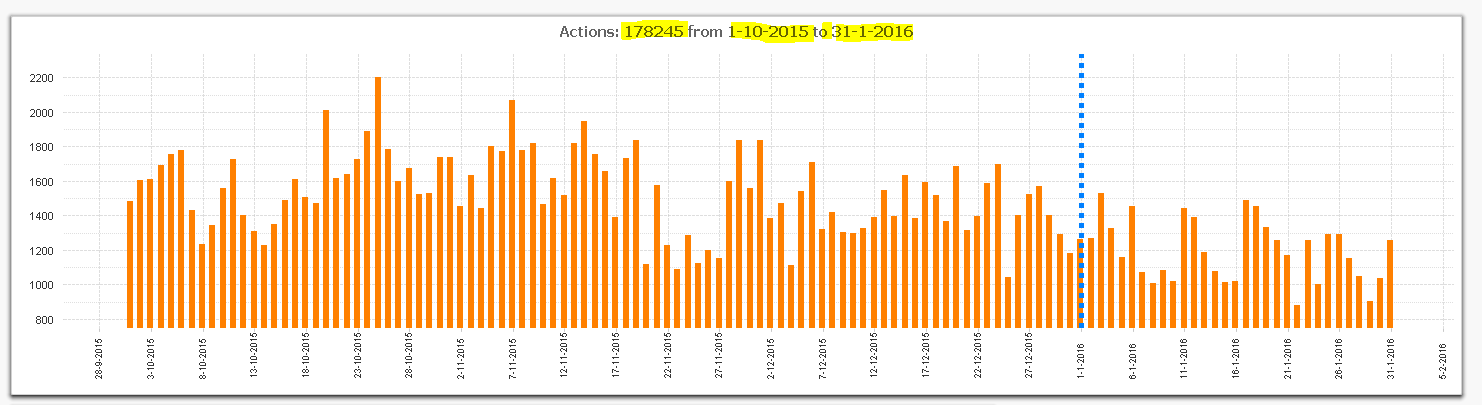
But when I make a selection from within the graph still the same values apprear: (although the selection now is 12/16 - 1/22
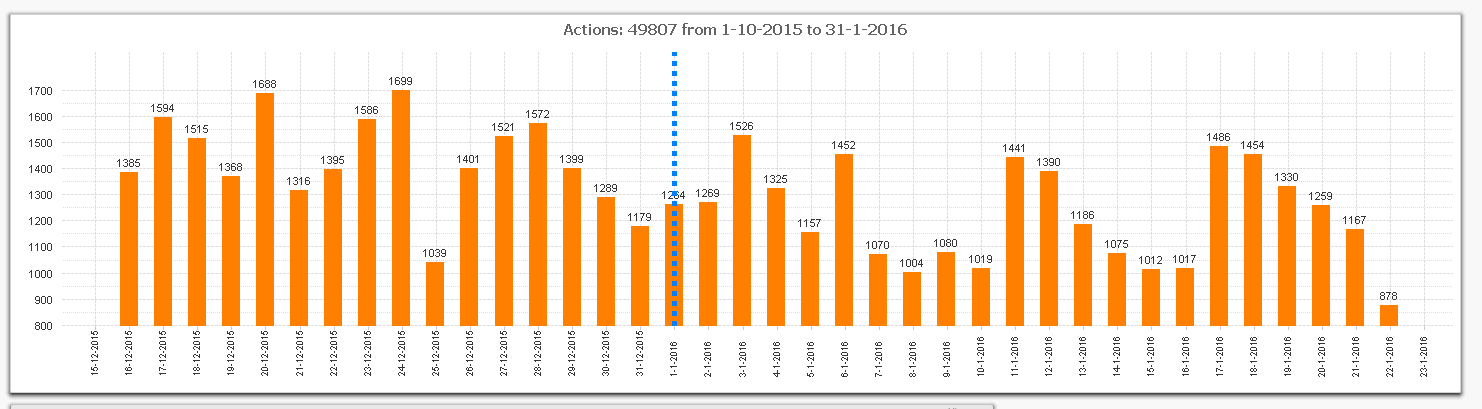
Hope someone can give me the code that I need to use to have the default and when a selection is made, it follows the min max from the selection.
Thanking you in advance!
Alex
- Tags:
- new_to_qlikview
Accepted Solutions
- Mark as New
- Bookmark
- Subscribe
- Mute
- Subscribe to RSS Feed
- Permalink
- Report Inappropriate Content
I think this in a text box should work:
Date(Min(DateField), 'D-M-YYYY') & ' to ' & Date(Max(DateField), 'D-M-YYYY')
When you select a subset of data, the dates will adjust.
UPDATE: You might want to add the same set analysis you have for your charts within the Min & Max function so that the text box object behave exactly like your chart.
- Mark as New
- Bookmark
- Subscribe
- Mute
- Subscribe to RSS Feed
- Permalink
- Report Inappropriate Content
Thank you very much Sunny T.
Perfect!
I will quickly go update many Management Reports with this addition. Thank you very much!