- Mark as New
- Bookmark
- Subscribe
- Mute
- Subscribe to RSS Feed
- Permalink
- Report Inappropriate Content
Win an e-book copy of Learning QlikView Data Visualization
This week I'm giving away three e-book copies of Learning QlikView Data Visualization.
To be eligible to win all you have to do is comment what data visualization method you would like to do in QlikView that you have not been able to do until now. It could either be a chart or a technique.
For example, I would like to do be able to do scatterplot matrices like the one below.
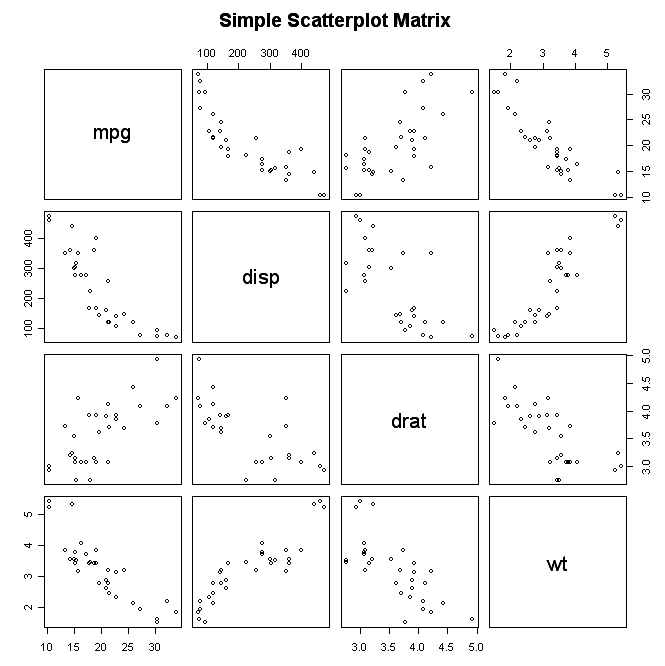
Don't forget to include a picture or link that explains the data visualization method you would like to do in QlikView.
Please respond by Monday, Nov. 4th and I will announce the winners on Wednesday, Nov. 6th after an old-fashioned drawing. Soon after the e-books will be delivered to the winners' e-mails as a Kindle e-book.
You don’t need a kindle to read the e-book. You can download the kindle application from amazon.com and view it from your laptop or iPad.
For more information, visit my blog http://bit.ly/18ATRLu.
Good luck!
- Mark as New
- Bookmark
- Subscribe
- Mute
- Subscribe to RSS Feed
- Permalink
- Report Inappropriate Content
Thank you all for participating. I've included you all in the drawing for tonight. I will announce the winners tomorrow.
Karl
- Mark as New
- Bookmark
- Subscribe
- Mute
- Subscribe to RSS Feed
- Permalink
- Report Inappropriate Content
Hi Rebeca,
Thanks. It is possible to do in native QlikView, but QlikView doesn't make it easy. Regards.
- Mark as New
- Bookmark
- Subscribe
- Mute
- Subscribe to RSS Feed
- Permalink
- Report Inappropriate Content
Hi Nicole,
I agree it would be nice if QlikView made it easier to create parallel coordinates charts. I recently posted on how to create one without using an extension.
KPI Parallel Coordinates Chart | Harvesting Wisdom
Karl
- Mark as New
- Bookmark
- Subscribe
- Mute
- Subscribe to RSS Feed
- Permalink
- Report Inappropriate Content
Hi Fred,
Just in case you haven't seen this post, I recommend it for creating a simplified version of a Gantt chart.
http://community.qlik.com/blogs/qlikviewdesignblog/2012/06/01/recipe-for-gantt-chart
Karl
- Mark as New
- Bookmark
- Subscribe
- Mute
- Subscribe to RSS Feed
- Permalink
- Report Inappropriate Content
Can't disagree to that.
Karl
- Mark as New
- Bookmark
- Subscribe
- Mute
- Subscribe to RSS Feed
- Permalink
- Report Inappropriate Content
Hi Philip,
I agree it would be nice if QlikView made it easier to create parallel coordinates charts. I recently posted on how to create one without using an extension.
KPI Parallel Coordinates Chart | Harvesting Wisdom
Karl
- Mark as New
- Bookmark
- Subscribe
- Mute
- Subscribe to RSS Feed
- Permalink
- Report Inappropriate Content
Hi Philippe,
The improvement of where various chart components are placed would be great. If there are few values in the legend you can place them below or above the chart using the Shift+Crtl.
Karl
- Mark as New
- Bookmark
- Subscribe
- Mute
- Subscribe to RSS Feed
- Permalink
- Report Inappropriate Content
Hi Alan,
You're right. The pop-ups could definitely improve.
Karl
- Mark as New
- Bookmark
- Subscribe
- Mute
- Subscribe to RSS Feed
- Permalink
- Report Inappropriate Content
Hi Manish,
I never thought about that. I don't know how easier that would be, but it would be great for story-telling.
Karl
- Mark as New
- Bookmark
- Subscribe
- Mute
- Subscribe to RSS Feed
- Permalink
- Report Inappropriate Content
Hi Sokkorn,
Good idea. QlikView does animation and it does trails, but it doesn't leave trails when animating.
Karl