- Mark as New
- Bookmark
- Subscribe
- Mute
- Subscribe to RSS Feed
- Permalink
- Report Inappropriate Content
Win an e-book copy of Learning QlikView Data Visualization
This week I'm giving away three e-book copies of Learning QlikView Data Visualization.
To be eligible to win all you have to do is comment what data visualization method you would like to do in QlikView that you have not been able to do until now. It could either be a chart or a technique.
For example, I would like to do be able to do scatterplot matrices like the one below.
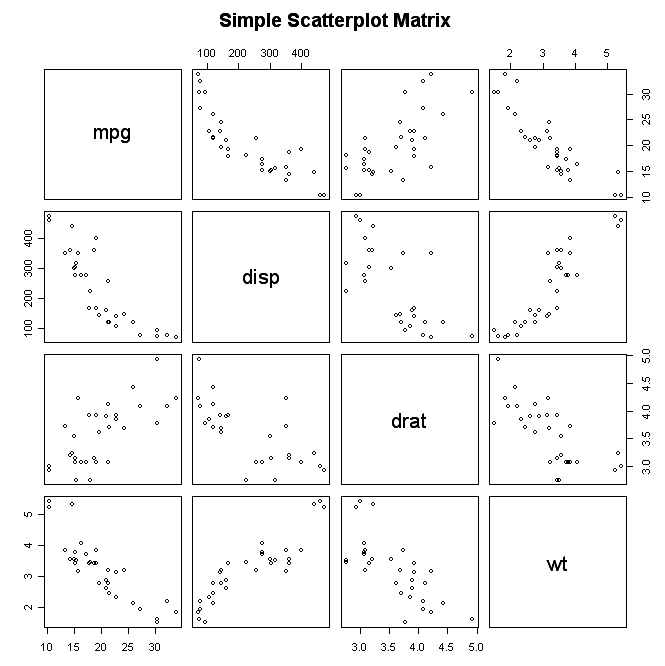
Don't forget to include a picture or link that explains the data visualization method you would like to do in QlikView.
Please respond by Monday, Nov. 4th and I will announce the winners on Wednesday, Nov. 6th after an old-fashioned drawing. Soon after the e-books will be delivered to the winners' e-mails as a Kindle e-book.
You don’t need a kindle to read the e-book. You can download the kindle application from amazon.com and view it from your laptop or iPad.
For more information, visit my blog http://bit.ly/18ATRLu.
Good luck!
- Mark as New
- Bookmark
- Subscribe
- Mute
- Subscribe to RSS Feed
- Permalink
- Report Inappropriate Content
Hi Rajesh,
I use Atlassian Jira with a Kanban or Scrum board for my QV projects, but I never thought how I would want to view one in QV. Hopefully, soon I'll be extracting info from Jira and do some experimenting in QlikView.
Karl
- Mark as New
- Bookmark
- Subscribe
- Mute
- Subscribe to RSS Feed
- Permalink
- Report Inappropriate Content
Hi Karl,
Thanks. I'll look into it
- Mark as New
- Bookmark
- Subscribe
- Mute
- Subscribe to RSS Feed
- Permalink
- Report Inappropriate Content
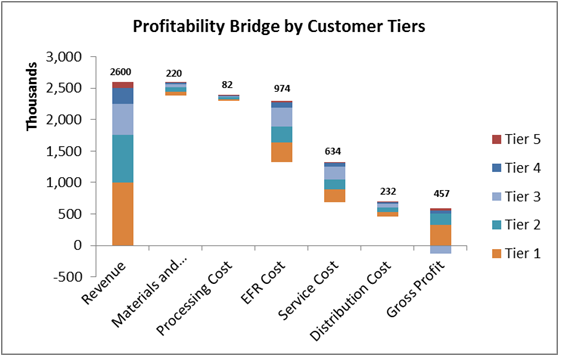
I would like to do stacked waterfall chart
- Mark as New
- Bookmark
- Subscribe
- Mute
- Subscribe to RSS Feed
- Permalink
- Report Inappropriate Content
This can be done already in Qlikview
- Mark as New
- Bookmark
- Subscribe
- Mute
- Subscribe to RSS Feed
- Permalink
- Report Inappropriate Content
I don't find any option for stacked waterfall. could you please share the sample if any?
- Mark as New
- Bookmark
- Subscribe
- Mute
- Subscribe to RSS Feed
- Permalink
- Report Inappropriate Content

- Mark as New
- Bookmark
- Subscribe
- Mute
- Subscribe to RSS Feed
- Permalink
- Report Inappropriate Content
Congrats to the winners of an e-book copy of Learning QlikView Data Visualization. http://bit.ly/178iCiC
- Rebeca Gums
- Sokkorn Cheav
- Philippe Grenier
Please send me a message in QlikCommunity with your e-mail address so that I can send you your e-book.
Karl
- Mark as New
- Bookmark
- Subscribe
- Mute
- Subscribe to RSS Feed
- Permalink
- Report Inappropriate Content
Sadick,
Here's a pretty basic example. The trick to doing it in QlikView is to create a bar chart and then insert the proper expression in the Bar Offset property of each expression that you can find by clicking the plus-sign next to the expression in the expressiones tab.
Karl
- Mark as New
- Bookmark
- Subscribe
- Mute
- Subscribe to RSS Feed
- Permalink
- Report Inappropriate Content
Thank you! Thank you! Thank you! Thank you!


Rebeca
- Mark as New
- Bookmark
- Subscribe
- Mute
- Subscribe to RSS Feed
- Permalink
- Report Inappropriate Content
What a great idea to have created this participative draw! Many thanks!