Unlock a world of possibilities! Login now and discover the exclusive benefits awaiting you.
Recent Documents
-
Linking to two or more dates
This tutorial presents a script pattern for assigning time dimensions to multiple fact dates in a data model. It answers the commonly asked Forum ques... Show MoreThis tutorial presents a script pattern for assigning time dimensions to multiple fact dates in a data model. It answers the commonly asked Forum question "how do I link to two dates"?
The pattern will demonstrate how to link all fact dates to a common calendar as well as using separate calendars for each fact date.

-
Set Analysis for certain Point in Time
Hi All,Sometimes there may be requirements from users where they want to see the charts in from certain point of time like YTD, QTD, MTD, Last 5 Years... Show MoreHi All,
Sometimes there may be requirements from users where they want to see the charts in from certain point of time like YTD, QTD, MTD, Last 5 Years etc., please find the set analysis expressions for this type of scenarios.
YTD Sales (Year To Date)
Sum({<Year=, Quarter=, Month=, Week=, Date={‘>=$(=YearStart(Today()))<=$(=Today())’}>} Sales )
Note: Year=, Quarter=, Month=, Week= excludes the selections in Year, Quarter, Month and Week dimensions.
QTD Sales (Quarter To Date)
Sum({<Year=, Quarter=, Month=, Week=, Date={‘>=$(=QuarterStart(Today()))<=$(=Today())’}>} Sales)
MTD Sales (Month To Date)
Sum({<Year=, Quarter=, Month=, Week=, Date={‘>=$(=MonthStart(Today()))<=$(=Today())’}>} Sales)
WTD Sales (Week To Date)
Sum({<Year=, Quarter=, Month=, Week=, Date={‘>=$(=WeekStart(Today()))<=$(=Today())’}>} Sales)
Last 5 Years Sales
Sum({<Year=, Quarter=, Month=, Week=, Date={‘>=$(=YearStart(Today(), -4))<=$(=Today())’}>} Sales )
Last 6 Quarters Sales
Sum({<Year=, Quarter=, Month=, Week=, Date={‘>=$(=QuarterStart(Today(), -5))<=$(=Today())’}>} Sales )
Last 12 Months Sales
Sum({<Year=, Quarter=, Month=, Week=, Date={‘>=$(=MonthStart(Today(), -11))<=$(=Today())’}>} Sales )
Last 15 Weeks Sales
Sum({<Year=, Quarter=, Month=, Week=, Date={‘>=$(=WeekStart(Today(), -14))<=$(=Today())’}>} Sales )
Last 10 Days Sales
Sum({<Year=, Quarter=, Month=, Week=, Date={‘>=$(=Date(Today()-9))<=$(=Today())’}>} Sales )
Yesterday Sales
Sum({<Year=, Quarter=, Month=, Week=, Date={‘$(=Date(Today()-1))’}>} Sales )
You can also arrive some flags for above scenarios in script and you use those flags in Set Analysis expression if your data always based on Current Date. Refer below link created by Richard.Pearce60
Calendar with flags making set analysis so very simple
Hope this helps.
Regards,
Jagan.

-
Working Hours Calculation excluding weekends and holidays
Calculating working hours is an essential measure in many business scenarios. In this post, I will demonstrate the steps to calculate this measure. Ad... Show MoreCalculating working hours is an essential measure in many business scenarios. In this post, I will demonstrate the steps to calculate this measure. Additionally, I will cover other aspects related to working hours, such as calculating overtime and excluding lunch breaks.
Note:
The example in this post assumes weekends are Saturday and Sunday. If your weekends fall on different days, please refer to the post linked below.
Working-days-and-hours-calculations-for-custom-weekends
Consider the following case:
Suppose a ticket is logged into the system on a certain day, referred to as the Start Date, and the same ticket is resolved on a different day, referred to as the End Date. We may want to calculate the working hours between these two dates to assess the efficiency of ticket closure time.
Here is how you can calculate it within the script
1) Calculate business working hours excluding week ends(Saturday and Sunday) and Holidays.
Following are the considerations
1) Count only standard working hours ( 9 AM - 6 PM) - You can change accordingly
2) Exclude Saturdays and Sundays
3) Exclude Holidays
You can adjust the date format of the variables below according to actual format in your data. Then use timestamp() function to represent it in required format.
SET TimeFormat='hh:mm:ss';
SET DateFormat='DD/MM/YYYY';SET TimestampFormat='DD/MM/YYYY hh:mm:ss';
Set up the variables below for standard working hours on weekdays. You can adjust the variables according to your working hours (e.g., 9 AM - 6 PM), and the rest of the calculations will be done automatically.
// Set the start and end hour of the day in 24 hour format
LET vStartHour = 9;
LET vEndHour = 18;
LET vWorkingHourPerDay = $(vEndHour) -$(vStartHour);
Set up the holiday list as shown below. Feel free to use your own holiday list.
Holidays:
LOAD Concat(chr(39)&Holidays&chr(39),',') as Holidays Inline [
Holidays
08/03/2016
09/03/2016
17/08/2010
];

LET vHolidays = Peek('Holidays',0,'Holidays');
Following is the logic to calculate the business working hours between to dates
Data:
LOAD *,
           rangesum(
           NetWorkDays(START_TIME+1,END_TIME-1,$(vHolidays)) * MakeTime($(vWorkingHourPerDay)), // In between hours
           if(NetWorkDays(END_TIME,END_TIME,$(vHolidays)),
           Rangemin(rangemax(frac(END_TIME),maketime($(vStartHour))),maketime($(vEndHour)))-
           Rangemax(rangemin(frac(END_TIME),maketime($(vStartHour))),maketime($(vStartHour))),0), // working hours last day
           if(NetWorkDays(START_TIME,START_TIME,$(vHolidays)),
           Rangemin(rangemax(frac(START_TIME),maketime($(vEndHour))),maketime($(vEndHour)))-
           Rangemax(rangemin(frac(START_TIME),maketime($(vEndHour))),maketime($(vStartHour))),0), // working hours first day
           if(NetWorkDays(START_TIME,START_TIME,$(vHolidays)) and floor(START_TIME)=floor(END_TIME),-MakeTime($(vWorkingHourPerDay))) // If same day  then correct the hours
           )*24 AS Business_Hrs_Without_Overtime,

          rangesum(if(NetWorkDays(START_TIME,START_TIME,$(vHolidays)) ,
          rangesum(if(frac(START_TIME)<maketime($(vStartHour)),maketime($(vStartHour))-frac(START_TIME),0),
          if(frac(END_TIME)>maketime($(vEndHour)),frac(END_TIME)-maketime($(vEndHour)),0))*24)) as Overtime ; // Overtime

LOAD *,
           timestamp(StartTime,'DD/MM/YYYY hh:mm:ss TT') as START_TIME,
           timestamp(EndTime,'DD/MM/YYYY hh:mm:ss TT') as END_TIME
Inline [
TicketNo,StartTime, EndTime
1, 8/25/2010 3:00:00 PM, 8/27/2010 6:00:00 PM
2, 8/16/2010 10:00:00 AM, 8/17/2010 1:00:00 PM
3, 8/17/2010 1:30:00 PM, 8/17/2010 2:45:00 PM
4, 8/17/2010 3:00:00 PM, 8/18/2010 5:00:00 PM
5, 8/18/2010 5:01:00 PM, 8/19/2010 4:00:00 PM
6, 8/19/2010 5:00:00 PM, 8/20/2010 10:00:00 AM
7, 8/20/2010 11:00:00 AM, 8/20/2010 5:00:00 PM
8, 8/23/2010 2:00:00 PM, 8/23/2010 4:00:00 PM
9, 8/23/2010 5:00:00 PM, 8/23/2010 6:00:00 PM
10, 8/24/2010 7:00:00 AM, 8/24/2010 2:00:00 PM
11, 8/20/2010 5:30:00 PM,8/23/2010 1:00:00 PM
12, 3/7/2016 4:00:00 PM, 3/10/2016 6:00:00 PM
13, 8/19/2010 11:00:00 AM, 8/20/2010 6:30:00 PM];

DROP Fields StartTime, EndTime;
You can then create measures to display working hours. Use the measure below if you want to present the working hours in hh:mm:ss format.
=interval(sum(Business_Hrs_Without_Overtime)/24,'hh:mm:ss')
2) Calculate business working hours excluding week ends(Saturday and Sunday), Lunch Breaks and Holidays.
Below are the considerations
1) Count only standard working hours ( 9 AM - 6 PM)
2) Exclude Saturdays and Sundays
3) Exclude Lunch Break (1 PM - 2PM)
4) Exclude Holidays
Set the Variables for standard working hours and lunch breaks. You can change the values according to your needs
// Set the start and end hour of the day in 24 hour format
LET vStartHour = 9;
LET vEndHour = 18;
LET vLunchStart =13;
LET vLunchEnd =14;
LET vWorkingHourPerDay = ($(vEndHour) -$(vStartHour))-($(vLunchEnd)-$(vLunchStart));
Include the Holidays
// Include the holidays list
Holidays:
LOAD Concat(chr(39)&Holidays&chr(39),',') as Holidays Inline [
Holidays
08/03/2016
09/03/2016
 ];

LET vHolidays = Peek('Holidays',0,'Holidays');
Following is the logic to calculate the business working hours between two dates
Data:
LOAD *,
             rangesum(
             NetWorkDays(START_TIME+1,END_TIME-1,$(vHolidays)) * MakeTime($(vWorkingHourPerDay)), // 12 hours per workday, for all day inbetween the period, excluding bounderies
             if(NetWorkDays(END_TIME,END_TIME,$(vHolidays)) ,
             rangesum(rangemin(frac(END_TIME),MakeTime($(vLunchStart)))- rangemin(frac(END_TIME),MakeTime($(vStartHour))) ,
             rangemin(frac(END_TIME),MakeTime($(vEndHour))) - rangemin(frac(END_TIME),MakeTime($(vLunchEnd)))),0), // working hours last day
             if(NetWorkDays(START_TIME,START_TIME,$(vHolidays)),
             rangesum(MakeTime($(vLunchStart)) - rangemin(rangemax(frac(START_TIME), MakeTime($(vStartHour))),MakeTime($(vLunchStart))),
             MakeTime($(vEndHour)) - rangemax(rangemin(frac(START_TIME), MakeTime($(vEndHour))),MakeTime($(vLunchEnd)))),0), // working first day
             if(NetWorkDays(START_TIME,START_TIME,$(vHolidays)) and floor(START_TIME)=floor(END_TIME),-MakeTime($(vWorkingHourPerDay))) // If the same day then correct the hours
             )*24 AS Business_Hrs_Without_Overtime,

             rangesum(if(NetWorkDays(START_TIME,START_TIME,$(vHolidays)) ,
             rangesum(if(frac(START_TIME)<maketime($(vStartHour)),maketime($(vStartHour))-frac(START_TIME),0),
             if(frac(END_TIME)>maketime($(vEndHour)),frac(END_TIME)-maketime($(vEndHour)),0))*24)) as Overtime ; // Overtime

LOAD *,
            timestamp(StartTime,'MM/DD/YYYY hh:mm:ss TT') as START_TIME,
            timestamp(EndTime,'MM/DD/YYYY hh:mm:ss TT') as END_TIME;
LOAD * Inline [
TicketNo,StartTime, EndTime
1, 8/16/2010 7:00:00 AM, 8/16/2010 7:00:00 PM
2, 8/16/2010 10:00:00 AM, 8/16/2010 1:30:00 PM
3, 8/16/2010 9:00:00 AM, 8/16/2010 2:00:00 PM
4, 8/16/2010 11:00:00 AM, 8/16/2010 1:00:00 PM
5, 8/16/2010 1:15:00 PM, 8/16/2010 1:45:00 PM
6, 8/16/2010 3:00:00 PM, 8/16/2010 7:00:00 PM
7, 8/16/2010 1:30:00 PM, 8/16/2010 6:00:00 PM
8, 8/16/2010 2:00:00 PM, 8/16/2010 7:00:00 PM
9, 8/16/2010 5:00:00 PM, 8/16/2010 6:00:00 PM
10, 8/16/2010 7:00:00 AM, 8/16/2010 1:00:00 PM
11, 8/16/2010 9:30:00 AM,8/16/2010 11:00:00 AM
12, 8/16/2010 1:00:00 PM, 8/16/2010 1:34:00 PM
13, 8/16/2010 2:00:00 PM, 8/17/2010 7:00:00 PM
14, 8/16/2010 1:00:00 PM, 8/17/2010 6:00:00 PM
15, 8/16/2010 9:00:00 AM, 8/17/2010 1:00:00 PM
16, 8/16/2010 3:30:00 PM,8/17/2010 2:00:00 PM
17, 8/16/2010 7:00:00 AM, 8/17/2010 5:00:00 PM
18, 8/17/2010 10:00:00 AM, 8/19/2010 5:00:00 PM
19, 8/17/2010 3:00:00 PM, 8/19/2010 4:00:00 PM
20, 8/19/2010 1:00:00 PM, 8/24/2010 11:00:00 AM
];
Please refer to the attached applications.
Please feel free to share any suggestions.
-
Example of Selecting Multiple Field Values
In this post, I will demonstrate how to programmatically select multiple values in a field.We know that manually, we can select multiple field values ... Show MoreIn this post, I will demonstrate how to programmatically select multiple values in a field.
We know that manually, we can select multiple field values by pressing down on the Ctrl button and selecting the values in the field one at a time.
Screenshot of two values selected in the Year field: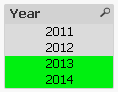
There may be times when you have a requirement to pre-select multiple values programmatically, for example the current and previous months need to be selected when the document is opened.
Selecting multiple field values can be done through Actions.
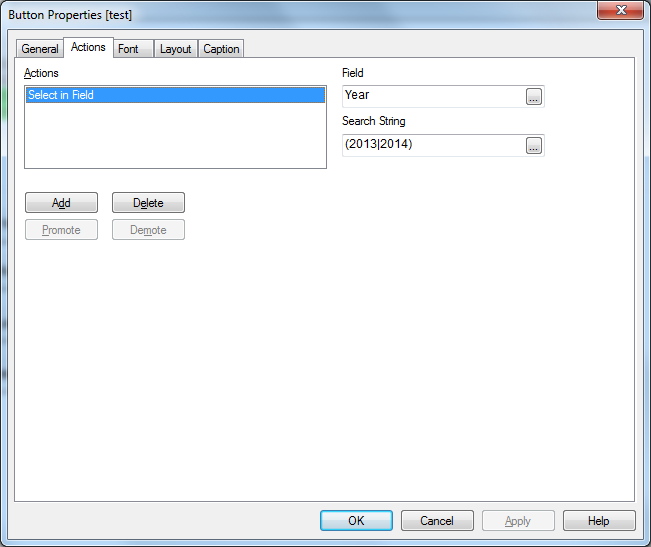
The following steps illustrate how to add an Action to select 2013 and 2014 values in the Year field for a button (Actions can be added to other objects, such as the Sheet, Document, etc.):
- Go to the Properties of the button object
- Navigate to the Actions tab and add a new Action
- Choose the Selection for Action Type and choose Select in Field for Action
- In the Field textbox, enter the field name, in this example Year
- In the Search String textbox, enter the values to be selected, separated by the vertical bar | and enclosed in parentheses (), in this example (2013|2014)
The following screenshot illustrates the values 2013 and 2014 for the Year field:
When you press on the button, both 2013 and 2014 values should be selected together in the Year field.
Using Expressions:
The search string can also take expressions using the following syntax:
='(' & Expression1 & '|' & Expression2 & ')'
An example of using an expression to determine last and next month from today’s month:
='(' & Month(AddMonths(Date(Today()), -1)) & '|' & Month(AddMonths(Date(Today()), +1)) & ')'
An example of using variables for current and previous months:
='(' & $(vCurrentMonth) & '|' & $(vPreviousMonth) & ')'
Sample Application:
This post includes a sample application that illustrates a few options for selecting multiple values in a field.
Hope this post was helpful to you.

-
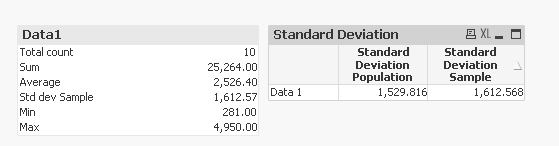
Standard Deviation (Population vs. Sample)
Inspired by swuehl's response here: Help with Standard deviation Full population No... | Qlik Community I thought it make sense to share a way to cal... Show MoreInspired by swuehl's response here: Help with Standard deviation Full population No... | Qlik Community I thought it make sense to share a way to calculate population standard deviation as QlikView's Stdev() seems to be a sample standard deviation. The difference between the two becomes negligible as the number of data point increases, but there might be a use case to apply population standard deviation for a smaller dataset.
I start with no dimension in an Excel file
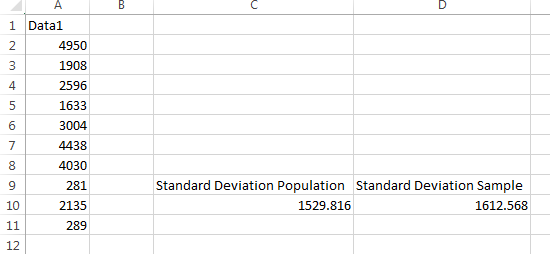
If you look at the statestic box, you will see that the standard deviation will show the sample stdev number
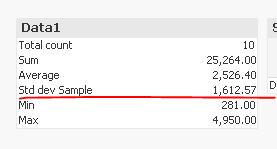
Also, when you use =Stdev(Data1), it will show the same number as above. In order to get population stdev, all you need to do is to multiple the standard deviation with this
=Stdev(Data1) * sqrt((Count(Data1)-1)/Count(Data1))
In other words, I am multiplying the Sample standard deviation with Sqrt((Number of Observations - 1)/Number of observations). So, for the above sample it would be Sqrt(9/10).
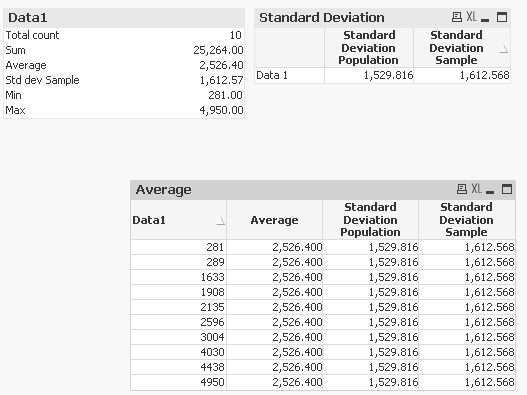
And the same logic can be carry forward to a table to create confidence intervals using TOTAL qualifer
Sample
=Stdev(TOTAL Data1)
Population
=Stdev(TOTAL Data1) * sqrt((Count(TOTAL Data1)-1)/Count(TOTAL Data1))
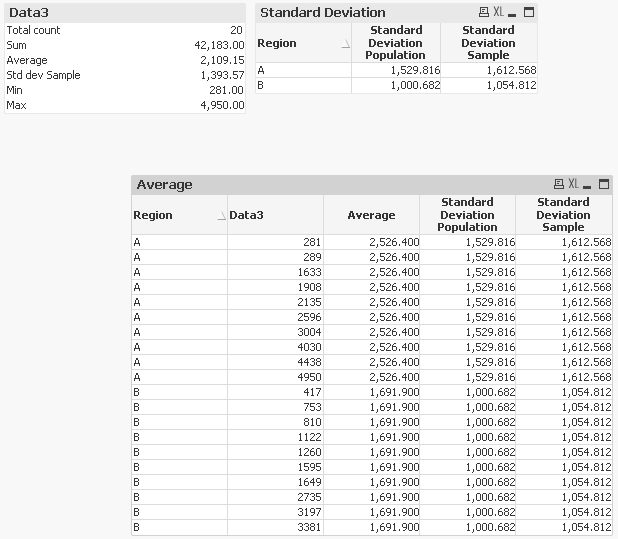
Same idea can be applied if you want to calculate Sample or Population Standard Deviation by Dimension
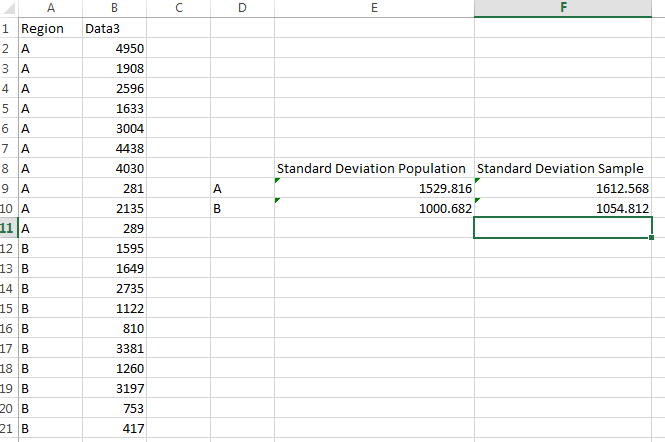
In the a chart, you can use these expressions
Sample
=Stdev(TOTAL <Region> Data3)
Population
=Stdev(TOTAL <Region> Data3) * sqrt((Count(TOTAL <Region> Data3)-1)/Count(TOTAL <Region> Data3))
-
Generic keys
Generic Keys is a way to define keys between tables in a more general way so that their values can represent other things than individual key values; ... Show MoreGeneric Keys is a way to define keys between tables in a more general way so that their values can represent other things than individual key values; they can represent groups of key values or any key value. As an example, you can combine product IDs, product group IDs and a symbol for all products into one key field.
You can use generic keys to solve many data modeling problems:
- Authorization table with OR-logic between fields
If you have an authorization table you sometimes want to have a slightly more complex access restriction than a simple logical AND between fields. It could be e.g., that a user is allowed to see sales for all regions for a specific product and at the same time the European sales for all products. Generic keys can be used here. - Mixed dimensional granularity in a single fact table
Often you want to compare actual numbers with budget numbers. The standard method is to concatenate these two tables into one common fact table. However, this new fact table could have mixed granularity in many of the dimensions. Generic keys can be used here. - Multiple fact tables linked using a master link table
Sometimes you have fact tables that are so different that you don’t want to concatenate them. To solve this problem you can make a data model that has a central link table and uses generic keys.
See more in the attached files.
PS I have been asked to make an example on comparing budget and actual numbers, so here it comes as a second attachment. It is a zip file with a mock-up order database with a budget. Create a new empty qvw; expand the zipped files in the same folder as the qvw; insert one of the two included script files into the qvw and run the script.

- Authorization table with OR-logic between fields
-
Aggr() and set analysis: set modifiers inside and / or outside aggr()?!?
Hi community,"Where should the set modifier be placed? Inside and/or outside the aggr()?"The standard answer is mostly:"If you are unsure, you should ... Show MoreHi community,
"Where should the set modifier be placed? Inside and/or outside the aggr()?"
The standard answer is mostly:
"If you are unsure, you should place the set modifiers inside and outside the aggr(). This will probably lead to the desired result..."
I just can't agree. In my opinion it really, really! depends...
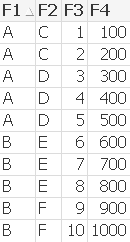
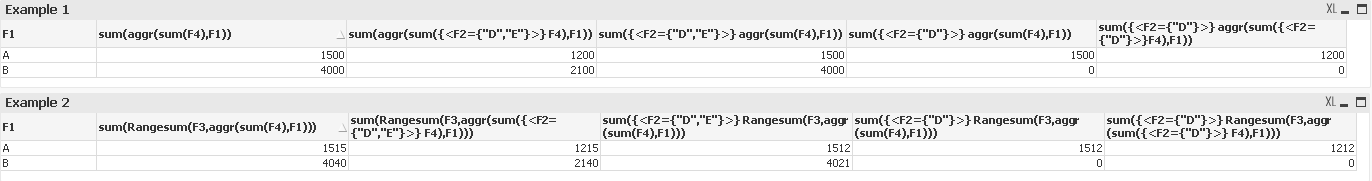
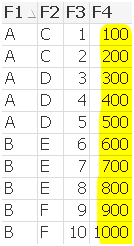
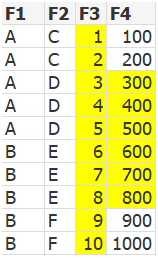
Example 1
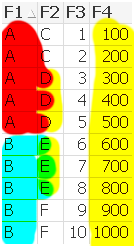
sum(aggr(sum(F4),F1))
--> default case
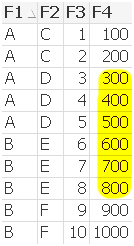
sum(aggr(sum({<F2={"D","E"}>} F4),F1))
--> set modifier at inner aggregation limits F4 values
sum({<F2={"D","E"}>} Rangesum(F3,aggr(sum(F4),F1)))
--> set modifier at outer aggregation
--> no difference , because F1={A} exists for F2={D} and F1={B} exists for D2={E}
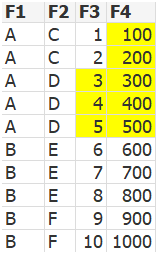
sum({<F2={"D"}>} aggr(sum(F4),F1))
--> set modifier at outer aggregation
--> F1={A} exists for F2={D} and F1={B} doesn‘t exist for D2={E}
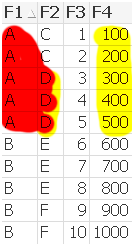
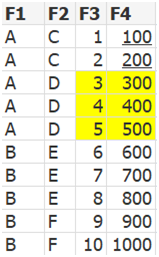
sum({<F2={"D"}>} aggr(sum({<F2={"D"}>}F4),F1))
--> set modifier at inner and outer aggregation
--> F1={A} exists for F2={D} and F1={B} doesn‘t exist for D2={E}
--> set modifier at inner aggregation limits F4 values
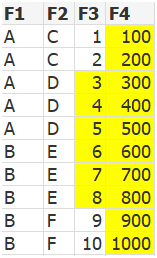
Example 2
sum(Rangesum(F3,aggr(sum(F4),F1)))
--> default case
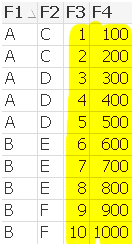
sum(Rangesum(F3,aggr(sum({<F2={"D","E"}>} F4),F1)))
--> set modifier at inner aggregation limits F4 values inside aggr()
--> but doesn’t limit F3 outside aggr()
sum({<F2={"D","E"}>} Rangesum(F3,aggr(sum(F4),F1)))
--> set modifier at outer aggregation limits only F3 field, because F1={A} exists for F2={D} and F1={B} exists for D2={E}
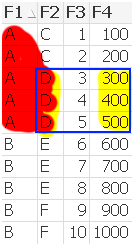
sum({<F2={"D"}>} Rangesum(F3,aggr(sum(F4),F1)))
--> set modifier at outer aggregation
--> limits F3 and F4, because F1={A} exists for F2={D} and F1={B} doesn‘t exist for D2={E}
sum({<F2={"D"}>} Rangesum(F3,aggr(sum({<F2={"D"}>} F4),F1)))
--> set modifier at inner and outer aggregation limts F3 and F4 values
Regards
Robin
-
YTQ, QTD, MTD and WTD
Year, Quarter, Month and Week To Date are the common analysis that I seen many applications. I will share the expression to do hereFirst to do this yo... Show MoreYear, Quarter, Month and Week To Date are the common analysis that I seen many applications. I will share the expression to do here
First to do this your data model should have the DateField in number format by applying floor
Similar to this
Floor(DateField) AS DateNum //it will gives you one whole number to represent date
YTD - Year To Date
A date should be selected and it will look for the Starting date of the year to the selected date.
Ex: date selected is 21-03-2014 then YTD is 01-01-2014 to 21-03-2014
Expression would be
Sum({<Year=, Month=, Quarter=, Week=, DateField=, DateNum={">=$(=Num(YearStart(Max(DateNum))))<=$(=Max(DateNum))"}>} Sales)
QTD- Quarter to Date
In the place of year use Quarter
Sum({<Year=, Month=, Quarter=, Week=, DateField=, DateNum={">=$(=Num(QuarterStart(Max(DateNum))))<=$(=Max(DateNum))"}>} Sales)
MTD- Month to Date
Sum({<Year=, Month=, Quarter=, Week=, DateField=, DateNum={">=$(=Num(MonthStart(Max(DateNum))))<=$(=Max(DateNum))"}>} Sales)
WTD- Week to Date
Sum({<Year=, Month=, Quarter=, Week=, DateField=, DateNum={">=$(=Num(WeekStart(Max(DateNum))))<=$(=Max(DateNum))"}>} Sales)
if you want you can set a variable value as 'Year', 'Month', 'Quarter', 'Week', lets say vToDate and go with single chart and single expression
Sum({<Year=, Month=, Quarter=, Week=, DateField=, DateNum={">=$(=Num($(=vToDate& 'Start(Max(DateNum))')))<=$(=Max(DateNum))"}>} Sales)
Will keep your expression simple
Regards,
Celambarasan

-
Convert Gauss-Kruger (GK) coordinates to Latitude/Longitude
This article is about converting the GK (Gauss-Krüger) coordinates into WGS 84 (Latitude/Longitude)Background:In cartography, the term Gauss–Krüger Ge... Show MoreThis article is about converting the GK (Gauss-Krüger) coordinates into WGS 84 (Latitude/Longitude)
Background:
In cartography, the term Gauss–Krüger Geographic coordinate system is named after Carl Friedrich Gauss (1777-1855) and Johann Heinrich Louis Krüger. It is a particular set of transverse Mercator projections (map projections) used in narrow zones in Europe and South America, at least in Germany, Turkey, Austria, Slovenia, Croatia, Macedonia, Finland and Argentina. This Gauss–Krüger system is similar to the universal transverse Mercator system (UTM), but the central meridians of the Gauss–Krüger zones are only 3° apart, as opposed to 6° in UTM. Depending on the zone of the Gauss-Kruger coordinates, different EPSG codes are applicable (The country of Germany is within the EPSG-Codes 31466 to 31469). Nevermind about the EPSG code, the below conversion works on any Gauss-Kruger coordinates.
The typical Gauss-Krüger coordinates is a pair of "Rechtswert" (East) and "Hochwert" (North) coordinates, both numbers are 7 digits long, may have up to 3 decimals (since the unit is meter, decimals don't make much sense as they are about decimeters, centimeters, even millimeter).
Links:
- An online translater example is here: WGS84 L�nge/Breite oder Gau�-Kr�ger nach MGRS :: Geograph Deutschland
It supports even http-get requests. - I would not have been able to solve this without this How-To Excel. http://www.kram.de/pca/koordinatenumrechnung.xls Thanks to the author!
- http://en.wikipedia.org/wiki/Gauss%E2%80%93Kr%C3%BCger_coordinate_system
- DE:Gauß-Krüger - OpenStreetMap Wiki (in German)
Solution:
Enough about the background, to convert given set of Gauss-Krüger coordinates from a given "Rechtswert" (East) and "Hochwert" (North) in QlikView add the following script fragments. Adjust the values of XCOORD_Field and Y_COORD Field with the effective column names in which the GK values are found in the later LOAD statement.
// constants
LET XCOORD_Field = 'XKOORD';
LET YCOORD_Field = 'YKOORD';
// Formulas
SET @rho = 57.29577951; //=180/PISET @e2 = 0.006719219;
SET @b1 = "($(YCOORD_Field)/10000855.7646)";
SET @b2 = "Pow($(@b1),2)";
SET @bf = "325632.08677*$(@b1)*((((((0.00000562025*$(@b2)-0.0000436398)*$(@b2)+0.00022976983)*$(@b2)-0.00113566119)
*$(@b2)+0.00424914906)*$(@b2)-0.00831729565)*$(@b2)+1) / 3600/ $(@rho)";
SET @fa = "(($(XCOORD_Field)-(Floor($(XCOORD_Field)/1000000)*1000000)-500000)/(6398786.849/Sqrt(1+(Pow(COS($(@bf)),2)*$(@e2)))))";
SET @LAT_Formula = "($(@bf)-(Pow($(@fa),2)*(Sin($(@bf))/Cos($(@bf)))*(1+(Pow(COS($(@bf)),2) * $(@e2)))/2)
+(Pow($(@fa),4)*(Sin($(@bf))/Cos($(@bf)))*(5+(3*Pow(Sin($(@bf))/Cos($(@bf)),2))+(6*(Pow(COS($(@bf)),2)
* $(@e2)))-(6*(Pow(COS($(@bf)),2) * $(@e2))*Pow(Sin($(@bf))/Cos($(@bf)),2)))/24)) * $(@rho)";
SET @LON_Formula = "(($(@fa)-(Pow($(@fa),3)*(1+(2*Pow(Sin($(@bf))/Cos($(@bf)),2))+(Pow(COS($(@bf)),2)
* $(@e2)))/6)+(Pow($(@fa),5)*(1+(28*Pow(Sin($(@bf))/Cos($(@bf)),2))+(24*Pow(Sin($(@bf))/Cos($(@bf)),4)))/120))
* $(@rho)/COS($(@bf))) + (Floor($(XCOORD_Field)/1000000)*3)";
Now if you import a file or table with Gauss-Krüger coordinates in fields XKOORD / YKOORD this is your script (dark-blue part). If you plan to use QlikView's built-in Mapping Extension "Quick Map" or "QlikView Mapping Extension", the coordinates-pair needs to go into one field, which I am calling LON_LAT. They need to have US number format. use the dark-red part of the script as well.
SET US_Format = "'','.',' '";
LOAD
*
,Num(LON,$(US_Format)) & ',' & Num(LAT,$(US_Format)) AS LON_LAT
;
LOAD
ID
,XKOORD,
,YKOORD
,$(@LAT_Formula) AS LAT
,$(@LON_Formula) AS LON
FROM
[myExcel.xlsx]
(ooxml, embedded labels);
Enjoy,
Christof
- An online translater example is here: WGS84 L�nge/Breite oder Gau�-Kr�ger nach MGRS :: Geograph Deutschland
-
The Fastest Dynamic Calendar Script (Ever)
Me and a colleague have put together a new Calendar, combining a super fast method for generating the needed calendar, while also removing a lot confi... Show MoreMe and a colleague have put together a new Calendar, combining a super fast method for generating the needed calendar, while also removing a lot configuration options in the previous methods.
So if you're using a Min/Max based approach like the one described here: Creating A Master Calendar
Then you're properly used to waiting for the Min/Max to find the largest values in your dataset. This can take minutes. What we have here takes less than a second. I've actually not been able to time this, because this calendar script takes less than a 1 seconds even on billions of rows on decent hardware. The only exception to this is if you use a date range starting before christ and spans a thousand years. If you have a date range, with a lot of holes in it (dates with no data), then you should use the last parameter:
Call Calendar('[Date (NK)]','MyCal','Pre.','','true');
The Attached qvw shows both methods (remember the qvs file).
I've not commented it, because most people will not grasp what is going on anyway, and don't need to
To try it out, include the following in your script, and add this to your code:
Call Calendar('DateField');
/* ************************************************************************************
itelligence Standard Qlik Calender Torben Seebach/Martin Didriksen Special Thanks to Rob Wunderlich and John Witherspoon
Configure Calender parameters
Syntax:
Calendar(DateField[,CalendarName][,Prefix[,Suffix[,FullCalendar]]])
Example:
Call Calendar('Date (NK)','MyCal','Pre.','','true'); // creates a the MyCal table and fields are prefixed with Pre. In the superfast variat
Call Calendar('Date (NK)'); //creates a table called calendar based of "Date (NK)" field
Mandatory:
@_DateField Contains the name of the field to connect the calendar to
Optional:
@_CalendarName Contains the name of the calendar we create
@_CalendarPrefix A Prefix for all fields
@_CalendarSuffix A Suffix for all fields
@_FullCalendar If this contains a value then it creates a calendar with all dates from Min(Date) to Max(Date), default is the slowest option************************************************************************************ */
Sub Calendar (_DateField,_CalendarName,_CalendarPrefix,_CalendarSuffix,_FullCalendar)
Let _StartTime = Now();
Let _CalendarName = If(Len('$(_CalendarName)')=0,'Calendar','$(_CalendarName)');
Let _CalendarPrefix = If(Len('$(_CalendarPrefix)')=0,'','$(_CalendarPrefix)');
Let _CalendarSuffix = If(Len('$(_CalendarSuffix)')=0,'','$(_CalendarSuffix)');
Let _FullCalendar = If(Len('$(_FullCalendar)')=0,1,0);
Let _DateField = PurgeChar(_DateField,'"[]');"$(_CalendarName)":
LOAD
Distinct [$(_DateField)] as [$(_DateField)],
Text(Date([$(_DateField)])) as [$(_CalendarPrefix)DateText$(_CalendarSuffix)],
Year([$(_DateField)]) as [$(_CalendarPrefix)Year$(_CalendarSuffix)],
Week([$(_DateField)])&'-'&Year([$(_DateField)]) as [$(_CalendarPrefix)WeekYear$(_CalendarSuffix)],
Week([$(_DateField)]) as [$(_CalendarPrefix)Week$(_CalendarSuffix)],
Month([$(_DateField)]) as [$(_CalendarPrefix)Month$(_CalendarSuffix)],
Year([$(_DateField)])&'-'&Text(Date([$(_DateField)],'MM')) as [$(_CalendarPrefix)YearMonth$(_CalendarSuffix)], 'Q'&Ceil(Month([$(_DateField)])/3) as [$(_CalendarPrefix)Quarter$(_CalendarSuffix)],
AutoNumber(MonthStart([$(_DateField)]),'_MonthSerial') as [$(_CalendarPrefix)MonthSerial$(_CalendarSuffix)],
AutoNumber(QuarterStart([$(_DateField)]),'_QuarterSerial') as [$(_CalendarPrefix)QuarterSerial$(_CalendarSuffix)],AutoNumber(weekyear([$(_DateField)]) &'|'&week([$(_DateField)]),'_WeekSerial') as [$(_CalendarPrefix)WeekSerial$(_CalendarSuffix)] ;
If _FullCalendar=1 Then
LOAD Date(_DateStart+(Iterno()-1),'$(DateFormat)' ) as [$(_DateField)]
While (_DateStart+(Iterno()-1)<=_DateStop);
LOAD
Floor(Min(Fieldvalue('$(_DateField)',RecNo()))) as _DateStart,
Floor(Max(Fieldvalue('$(_DateField)',RecNo()))) as _DateStop
AUTOGENERATE FieldValueCount('$(_DateField)');
Else
LOAD Num(Fieldvalue('$(_DateField)',RecNo())) as [$(_DateField)]
AUTOGENERATE FieldValueCount('$(_DateField)');
End If/* clean variables */
Let _TotalTime = Round((Now()-_StartTime)*60*60*24,0.00000000001);
Let _StartTime = NULL;
Let _vDateStart = NULL;
Let _vDateStop = NULL;
Trace $(_CalendarName) created in: $(_TotalTime) seconds;
Let _TotalTime = NULL;ENDSUB
Updated 2014-05-23:
- Implement preceding load method suggested by Rob Wunderlich
- Fixed Timer to show seconds
- Corrected error in documentation
- Added PurgeChar so [Date A],"Date B" also works.
- Thanks to Stephen Redmond for pointing to a boolean error in line 22
Other than my brilliant Collegue Martin Didriksen, I also want to give John Witherspoon some credit for inspiration on the autogerate method used. I think he was the first who posted it online.

-
Replace characters with Ascii numbers in a string
Hi,The below code helps in replacing characters with ASCII codes in a string in Load script For exampleABC is converted to 656667- since ASCII code of... Show MoreHi,
The below code helps in replacing characters with ASCII codes in a string in Load script
For example
ABC is converted to 656667- since ASCII code of A is 65, B is 66 and C is 67.
CharMap:
Mapping LOAD
Chr(RecNo() - 1) AS Char,
RecNo() - 1 AS Asciicode
AutoGenerate 256;
Data:
LOAD
Text,
MapSubString('CharMap', Text) as formattedText
FROM DataSource;
Hope this helps.
Regards,
Jagan.
-
IntervalMatch and Slowly Changing Dimensions
What techniques are there to match a number with an interval?How does the IntervalMatch prefix work?Should I join the interval match table with the ev... Show More- What techniques are there to match a number with an interval?
- How does the IntervalMatch prefix work?
- Should I join the interval match table with the event table?
- How do I generate an interval from a single change date?
- What is a Slowly Changing Dimension?
- How do I model a multi-level Slowly Changing Dimension?
These questions and others are answered in this Technical Brief.
Thank you Barry for good discussions.
See also the following blog posts
Creating a Date Interval from a Single Date
Creating Reference Dates for Intervals
-
Comma problem (,) workaround for dollar sign expansion with parameters
HelloOne reason why you want to use dollar sign expansion is the possibility to store your expressions in variables and then use these variables in yo... Show MoreHello
One reason why you want to use dollar sign expansion is the possibility to store your expressions in variables and then use these variables in your chart expressions. THis will concentrate all business logic in one place and simplify chart expressions. But suppose you want to pass some parameters into these expressions. QlikView supports this, but there is very annoying problem. If there are any commas (,) in your parameter value, QlikView treats this as parameter separator but not as part of parameter value.
Recently I found some workaround for that. Suppose we have and expression stored in a variable varExpr. The value o expression is SUM({$< $1 >} quantity).
Now if I create a chart expression =$(varExpr(year)), this will convert into =SUM({$< year>} quantity) and it will calculate sum ofd quantity field with year field cleared. But what if I want to clear not just year field but month as well. I cannot do this by setting my chart expression to =$(varExpr(year, month)) this will not work and as a result I get the same expression =SUM({$< year>} quantity).
But If I use SUM({$< $(=REPLACE('$1', ';', ',')) >} quantity) for variable value and then =$(varExpr(year; month)) for chart expression - this will give me the expression I want =SUM({$<year, month>} quantity).
Cheers
Darius.

-
Simply create YTD, moving totals and comparisons versus Year Ago
When we want to do something with QlikView, we face so many possibilities to achive the goal. And sometimes, the first idea we have is not necessarily... Show More
When we want to do something with QlikView, we face so many possibilities to achive the goal. And sometimes, the first idea we have is not necessarily the simplest one.I wanted to do create YTD and moving totals measures, difference (absolute and in percentage) of these moving totals versus the Year ago. QlikView is a BI tool: no problem I thought. Well, it was not so simple ...
 The expressions became so complex that I finally did not understand them any more!
After some searches and many tries,the solution to such a chart is very simple. You just need to look at the right place.
As you can see, this chart contains actual data and the one of the year ago, a YTD starting in January and the same for the Year Ago, Rolling 3 and 12 periods and the same for the Year Ago. These values are contained in a TIME ANALYSIS axis that the user can select in a simple List Box to display only YTD and Rolling12 for example:
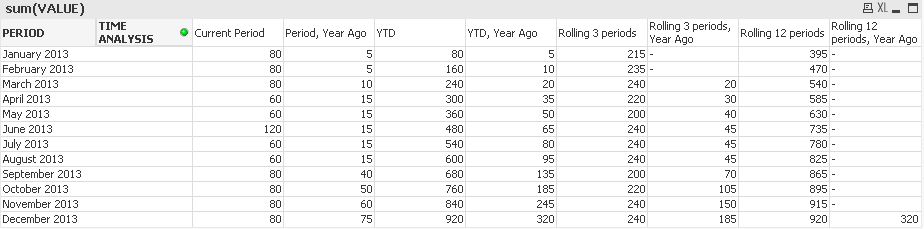
The document will help you to understand the modification you have to do to your data model to make this report very simple. As you can already see, the expression is the simplest expression in QlikView: sum(VALUE).
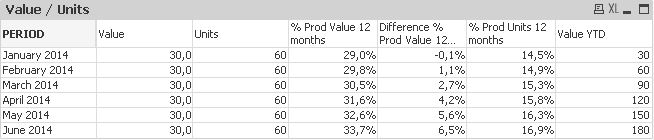
This simplicity let you afterwards mix the different measures of the database with this TIME ANALYSIS axis : get the current sales values, but the share the products represents the last 12 motnhs, and a difference vs year ago:
Many thanks to G. Wassenaar and his post that helped me to understand where to look exactly : http://community.qlik.com/docs/DOC-4252
Have a nice reading
Fabrice AUNEZ
I have attached sample QVW and Sample data. Hope this will be helpful for all..
-
How to use - Master-Calendar and Date-Values
Dimensions and calculations over periods are essential parts from nearly each reporting. The analysis from data regarding to periods is quite independ... Show MoreDimensions and calculations over periods are essential parts from nearly each reporting. The analysis from data regarding to periods is quite independent from the to analyse data-area regardless if this are sales-, finance-, human-ressources- or production-data. Nearly nothing is more exciting within an analysis as the development from data over the time and the questions which are following like: Was these development expected or not and what could be the reasons?
However the handling from time-data could be difficult whereas the most could be avoided with a few simple rules.
The easiest way is often to use a master-calendar as dimension-table which is linked to the fact-table(s). Why and how, see:
The Fastest Dynamic Calendar Script (Ever)
Master Calendar with movable holidays
In more complex data-models is it often necessary to create several calendars and/or to use calendars which are divergent to normal year-calendars.
Why You sometimes should Load a Master Table several times
Fiscal Calendar with Non-Standard Days (Not 1-31)
Important is to define and formate the time-dimension properly. Properly meant that the dimensions are (also) numeric then only numeric values could be calculated respectively compared with each other.
Background is that the date of 12/31/1899 is equal to 1 and each further day will be added by one so that the date of 12/31/1999 corresponds to 36525. Hours/Minutes/Seconds are fractions from 1, for example 1 / 24 / 60 = 0,000694 is equal to 1 minute.
This meant that all fields which should be calculated (comparing is calculation, too) should be (additionally) available as numeric field or as Dual-Field:
Often are additionally relative and/or continuing time-dimensions and flags very helpful to avoid complex calculations:
Creating Reference Dates for Intervals
Calendar with flags making set analysis so very simple
Period Presets: Compare Periods on the fly
Subroutine to Create Data Model for From/To Date Selection
Calendar with AsOf Flags, Compare Easter to Easter
Beside simple but frequent time-comparing with one or several time-dimensions in one object and simple expressions like sum(value) or count(order) are there more complicated questions like:
Previous YTQ, QTD, MTD and WTD
Calculating rolling n-period totals, averages or other aggregations
Beside the above used links you will find many interessting postings here within the qlik community to these topic - the notes here are a good starting point to go further.
Have fun!
ps: within the attachment is a german translation - deutsche Fassung.

-
Translation from Numbers in Words
Inspired through this question: General Q. and the solution which tresesco provided in the sub-link: how to convert number into words I thought that m... Show MoreInspired through this question: General Q. and the solution which tresesco provided in the sub-link: how to convert number into words I thought that must be (easier) possible with QlikView itself. At first I considered to split the number with a while-loop and catch to each single-number then a mapping-value. But because of the slight inhomogeneity from the spelling words to the numbers it would be some checking with if-loops necessary. Therefore I deceided to make it more simple. It needs only two small mapping-tables and a preceeding-load in which each word-part oft he number will be separate generated and afterwards simple string-concatenated and a little bit cleaned.
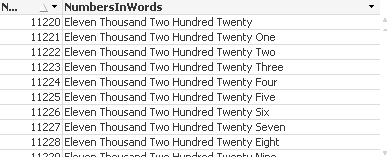
This example is restricted to numbers < 1M but the logic could be extended. I hope I have caught every possibility by the translation - but don't hesitate if you find a error or if you have ideas for improvements. And this is the result:
Map_FirstNumbers:
mapping Load * Inline [
FirstNumbers, Text
1, one
2, two
3, three
4, four
5, five
6, six
7, seven
8, eight
9, nine
10, ten
11, eleven
12, twelve
13, thirteen
14, fourteen
15, fifteen
16, sixteen
17, seventeen
18, eighteen
19, nineteen
20, twenty
];
Map_SecondNumber:
mapping Load * Inline [
SecondNumber, Text
2, twenty
3, thirty
4, fourty
5, fifthy
6, sixty
7, seventy
8, eighty
9, ninety
];
NumbersInWords:
load *, capitalize(trim(replace(NumbersInWordsRawFormat, Repeat(Chr(32), 3), chr(32)))) as NumbersInWords;
load *, [6 value] & [6 unit] & [4+5 value] & [4-6 unit] & [3 value] & [3 unit] & [1+2 value] as NumbersInWordsRawFormat;
load *,
if(right(Number, 2) < 21, applymap('Map_FirstNumbers', right(Number, 2), chr(32)),
if(right(Number, 2) < 100, applymap('Map_SecondNumber', mid(right(Number, 2), 1, 1), chr(32)) & chr(32) &
applymap('Map_FirstNumbers', mid(right(Number, 2), 2, 1), chr(32)))) as [1+2 value],
if(LenNumber >= 3, applymap('Map_FirstNumbers', num#(mid(right(Number, 3), 1, 1)), chr(32)), chr(32)) as [3 value],
if(LenNumber >= 3 and num#(mid(right(Number, 3), 1, 1)) > 0, ' hundred ', chr(32)) as [3 unit],
if(match(LenNumber, 4, 5, 6),
if(LenNumber = 4, applymap('Map_FirstNumbers', num#(mid(right(Number, 4), 1, 1)), chr(32)),
if(num#(mid(right(Number, 5), 1, 2)) < 1, chr(32), if(num#(mid(right(Number, 5), 1, 2)) < 21,
applymap('Map_FirstNumbers', num#(mid(right(Number, 5), 1, 2))),
if(num#(mid(right(Number, 5), 1, 2)) < 100, applymap('Map_SecondNumber', num#(mid(right(Number, 5), 1, 1)), chr(32)) & chr(32) &
applymap('Map_FirstNumbers', num#(mid(right(Number, 4), 1, 1)), chr(32)))))), chr(32)) as [4+5 value],
if(LenNumber >= 5, ' thousand ', if(LenNumber = 4 and num#(mid(right(Number, 4), 1, 1)) > 0, ' thousand ', chr(32))) as [4-6 unit],
if(LenNumber = 6, applymap('Map_FirstNumbers', num#(mid(right(Number, 6), 1, 1)), chr(32)), chr(32)) as [6 value],
if(LenNumber >= 6 and num#(mid(right(Number, 6), 1, 1)) > 0, ' hundred ', chr(32)) as [6 unit];
load recno() as Number, len(recno()) as LenNumber Autogenerate 999999;
-
Compound Search - demystified
Searching in field values is a powerful feature in QlikView (all this should also work in QlikSense, but I haven't tested everything). You can use sea... Show MoreSearching in field values is a powerful feature in QlikView (all this should also work in QlikSense, but I haven't tested everything). You can use searches for example in set analysis field modifier, select in field actions and not to forget filtering e.g. list boxes in the frontend.
Hence knowing the power of searches is vital to developers as well as end users.
Unfortunately (in terms of 'getting started with search'), there are several possible search modes, have a look at The Search String to get an overview.
Text searches continues explaining. Some of the search modes are explained a bit more detailed: The Expression Search
And there are some things to consider we would hardly know without following Henric Cronström's ( hic ) great design blog: Search - But what shall you find?
Not to forget, there is a nice cheat sheet: Qlik Sense Search Cheat Sheet, covering some features, but not everything.
There is also of course some documentation in the HELP file as well as the reference manual, but not what I would call a comprehensive documentation of this essential product feature. Especially, there is few documentation about the so called 'compound search'.
So let us shed some light on
QlikView's Compound Search feature
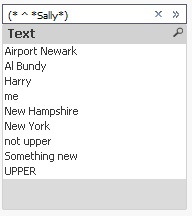
First, let's create some sample data:
SAMPLE:
LOAD RecNo() as Number, Text
INLINE [
Text
Harry
Sally
Harry & Sally
New Hampshire
New York
Something new
UPPER
not upper
Al Bundy
Airport Newark
me
];
- Triggering a compound search
A compound search is triggered by enclosing the search filter in parentheses (...)
The search itself will be performed over the values in the field's symbol table.
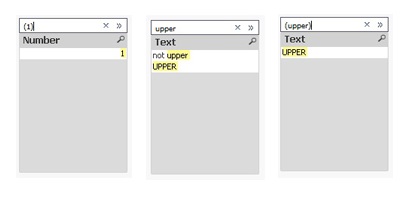
- The most simple possible search filter is just inputting a value. In contrary to other search modes, the compound search will search for values that exactely match your search term.
[Note: A case insensitive comparison will be performed, but according to some comments by Henric in above blog posts, this is considered a bug and may be fixed sometime in the future ]
For example, (1) put into a Number field list box search bar will return only the exact match '1', not all values that contain '1' or start with '1'. Another example: Try upper compaired to (upper) in Text list box search bar.
- Wildcards
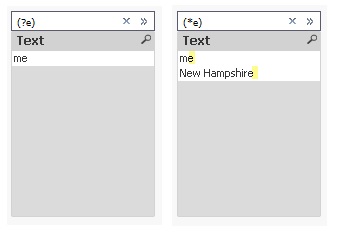
You can use wildcards in a compound search, too. A question mark '?' is a placeholder for any single character, a star symbol '*' for any number of not defined characters.
(?e) will return any value with two characters, second being an 'e'. (*e) will return any value that ends with an 'e'.
- Quoting
If your values contain spaces, you need to quote the value: ("Something New") will find the value, (Something New) not.
- Wildcard ^: Beginning of word
If you quote your search string, you can also use the wildcard '^' to match your search term with beginning of words in your values
(read further down why you need to quote here, even when there is no space contained):

[Note: As Henric commented to one of his blog posts, there is no escape character to escape a wildcard, hence if you want to search for e.g. '?', you would need another search mode, e.g. advanced search using =index(FIELD,'?') ]
- Combining searches using search operators:
Now it's getting a little bit more advanced: If you want to create some more complex searches, you can combine two or more searches with search operators:- OR operator '|'
Using this operator, your compound search will return values that match either the first or the second search, e.g.
- OR operator '|'
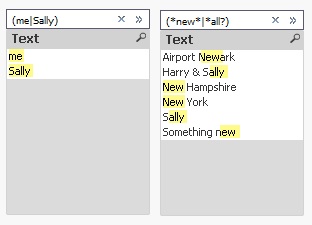
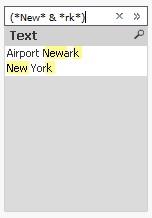
- AND operator '&'
Using this operator, your compound search will return values that match both first and second search, obviously, this does only make sense if you are using wildcards:
- Up to this point, all this can be found here in the forum, in Henric's design blog referenced above, in the comments to his blog, in the tech doc or in some other threads. But I hope this document will add something useful to all this already available, though distributed material. Introducing the AFAIK not really well-known
XOR operator '^'
Using this operator, your compound search will return values that match either the first or the second search, but not both:
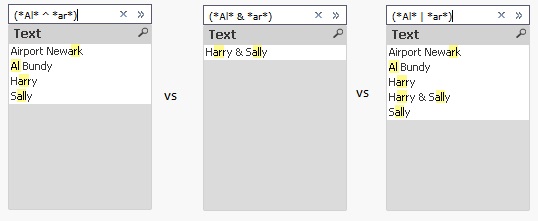
Another example for the XOR operator would be to find the complement of a search (for example search for *Sally*):
You could achieve this by selecting (Sally), then use the context menu to select excluded, but you can also use a single search: (* ^ *Sally*)
[Agreed, the syntax would be easier if there was an operator for NOT or complement, but I haven't found it so far. If you know it, please drop a comment below.]
All these operators can be used to not only combine two, but many searches: (me|Harry|Sally)
This would be a good point to end this document. But there is something more I haven't read about so far:
- Nesting compound searches
You can nest a compound search into another compound search. Why you may want to do this?
For example if you want to create a search like 'Return all values containing 'Harry', but exclude values where 'Sally' appears.
Since to my limited knowledge, there is no 'NOT' or complement unary search operator, you can emulate this search using the existing three search operators described above:

You can achieve similar without nesting, but take care of the order of your searches and operators:
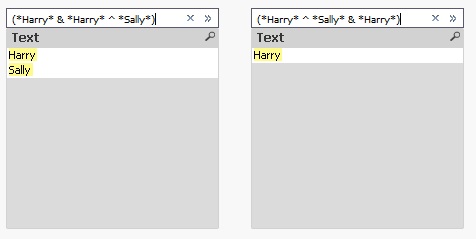
Some (or all?) of these results can of course be achieved using other search modes, I just wanted to focus on the compound search mode in this blog post. I hope all mysteries of the compound search have been revealed.
If you have any comments or questions, drop a comment below.
Have fun!
edits:
2016-02-02: Complement can be created easier, just using (* ^ *Sally*), added some more examples, reorganized some parts
- Triggering a compound search
-
Loading Multiple Excel Sheets Dynamically along with file name and sheet name
Hi All,This document helps you in loading multiple excels and excel sheets with the name of the sheet and data.//to read each file from the specified ... Show MoreHi All,
This document helps you in loading multiple excels and excel sheets with the name of the sheet and data.
//to read each file from the specified folder
FOR EACH file in FileList('filepath\*.xlsx');
//In order to get the file information from SQLtables command making use of the ODBC connection format
ODBC CONNECT32 TO [Excel Files;DBQ=$(file)];
tables:
SQLtables;
DISCONNECT;
FOR i = 0 to NoOfRows('tables')-1
LET sheetName = purgeChar(purgeChar(peek('TABLE_NAME', i, 'tables'), chr(39)), chr(36));
Table:
Load * ,
FileBaseName()as FIle,
FileDir() as Dir,
FileName() as File_Name,
'$(sheetName)' as Sheet_name
From $(file)(ooxml, embedded labels, table is [$(sheetName)]);
NEXT i
NextHope this helps !!!
please find the attachment for the eg: qvw and test fiels
Regards,

-
Set Analysis: syntaxes, examples
For those that find this document in a search - you may also want to check out these videos to learn Set Analysis:A Beginners' Introduction to Set Ana... Show MoreFor those that find this document in a search - you may also want to check out these videos to learn Set Analysis:
A Beginners' Introduction to Set Analysis
About the attached document:
The doc is organized by question:
- to select all or just known members
- to select through search strings, variables that can store just members but also the whole set
- to select using two fields, a boolean test, a function like concat(), sum(), p() or e(), rank()
In this updated version, I have added some few sections and some examples.
It is a translation of a french doc I have written few weeks ago: http://community.qlik.com/docs/DOC-4889
-


