Unlock a world of possibilities! Login now and discover the exclusive benefits awaiting you.
QlikView documentation and resources.
Recent Documents
-
Generic keys
Generic Keys is a way to define keys between tables in a more general way so that their values can represent other things than individual key values; ... Show MoreGeneric Keys is a way to define keys between tables in a more general way so that their values can represent other things than individual key values; they can represent groups of key values or any key value. As an example, you can combine product IDs, product group IDs and a symbol for all products into one key field.
You can use generic keys to solve many data modeling problems:
- Authorization table with OR-logic between fields
If you have an authorization table you sometimes want to have a slightly more complex access restriction than a simple logical AND between fields. It could be e.g., that a user is allowed to see sales for all regions for a specific product and at the same time the European sales for all products. Generic keys can be used here. - Mixed dimensional granularity in a single fact table
Often you want to compare actual numbers with budget numbers. The standard method is to concatenate these two tables into one common fact table. However, this new fact table could have mixed granularity in many of the dimensions. Generic keys can be used here. - Multiple fact tables linked using a master link table
Sometimes you have fact tables that are so different that you don’t want to concatenate them. To solve this problem you can make a data model that has a central link table and uses generic keys.
See more in the attached files.
PS I have been asked to make an example on comparing budget and actual numbers, so here it comes as a second attachment. It is a zip file with a mock-up order database with a budget. Create a new empty qvw; expand the zipped files in the same folder as the qvw; insert one of the two included script files into the qvw and run the script.
- Authorization table with OR-logic between fields
-
IntervalMatch and Slowly Changing Dimensions
What techniques are there to match a number with an interval?How does the IntervalMatch prefix work?Should I join the interval match table with the ev... Show More- What techniques are there to match a number with an interval?
- How does the IntervalMatch prefix work?
- Should I join the interval match table with the event table?
- How do I generate an interval from a single change date?
- What is a Slowly Changing Dimension?
- How do I model a multi-level Slowly Changing Dimension?
These questions and others are answered in this Technical Brief.
Thank you Barry for good discussions.
See also the following blog posts
Creating a Date Interval from a Single Date
Creating Reference Dates for Intervals
-
QlikView Date fields
QlikView has an intelligent algorithm to recognize dates independently of which region you are in. In most cases, you will have no problems loading th... Show MoreQlikView has an intelligent algorithm to recognize dates independently of which region you are in. In most cases, you will have no problems loading them. It just works and you do not need to think about it. However, in some cases dates are not properly recognized and then you need to add some code in the script to make it work.
-
Compound Search - demystified
Searching in field values is a powerful feature in QlikView (all this should also work in QlikSense, but I haven't tested everything). You can use sea... Show MoreSearching in field values is a powerful feature in QlikView (all this should also work in QlikSense, but I haven't tested everything). You can use searches for example in set analysis field modifier, select in field actions and not to forget filtering e.g. list boxes in the frontend.
Hence knowing the power of searches is vital to developers as well as end users.
Unfortunately (in terms of 'getting started with search'), there are several possible search modes, have a look at The Search String to get an overview.
Text searches continues explaining. Some of the search modes are explained a bit more detailed: The Expression Search
And there are some things to consider we would hardly know without following Henric Cronström's ( hic ) great design blog: Search - But what shall you find?
Not to forget, there is a nice cheat sheet: Qlik Sense Search Cheat Sheet, covering some features, but not everything.
There is also of course some documentation in the HELP file as well as the reference manual, but not what I would call a comprehensive documentation of this essential product feature. Especially, there is few documentation about the so called 'compound search'.
So let us shed some light on
QlikView's Compound Search feature
First, let's create some sample data:
SAMPLE:
LOAD RecNo() as Number, Text
INLINE [
Text
Harry
Sally
Harry & Sally
New Hampshire
New York
Something new
UPPER
not upper
Al Bundy
Airport Newark
me
];
- Triggering a compound search
A compound search is triggered by enclosing the search filter in parentheses (...)
The search itself will be performed over the values in the field's symbol table.
- The most simple possible search filter is just inputting a value. In contrary to other search modes, the compound search will search for values that exactely match your search term.
[Note: A case insensitive comparison will be performed, but according to some comments by Henric in above blog posts, this is considered a bug and may be fixed sometime in the future ]
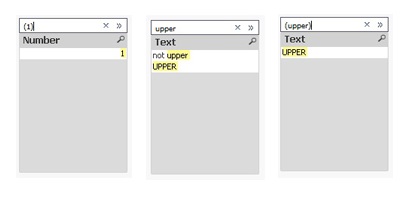
For example, (1) put into a Number field list box search bar will return only the exact match '1', not all values that contain '1' or start with '1'. Another example: Try upper compaired to (upper) in Text list box search bar.
- Wildcards
You can use wildcards in a compound search, too. A question mark '?' is a placeholder for any single character, a star symbol '*' for any number of not defined characters.
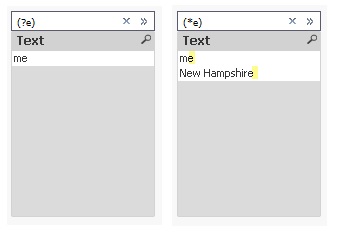
(?e) will return any value with two characters, second being an 'e'. (*e) will return any value that ends with an 'e'.
- Quoting
If your values contain spaces, you need to quote the value: ("Something New") will find the value, (Something New) not.
- Wildcard ^: Beginning of word
If you quote your search string, you can also use the wildcard '^' to match your search term with beginning of words in your values
(read further down why you need to quote here, even when there is no space contained):

[Note: As Henric commented to one of his blog posts, there is no escape character to escape a wildcard, hence if you want to search for e.g. '?', you would need another search mode, e.g. advanced search using =index(FIELD,'?') ]
- Combining searches using search operators:
Now it's getting a little bit more advanced: If you want to create some more complex searches, you can combine two or more searches with search operators:- OR operator '|'
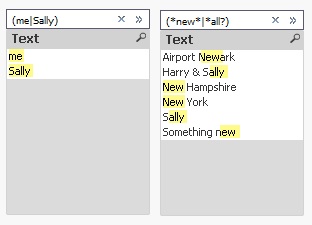
Using this operator, your compound search will return values that match either the first or the second search, e.g.
- OR operator '|'
- AND operator '&'
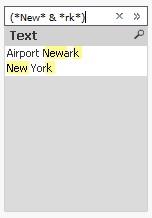
Using this operator, your compound search will return values that match both first and second search, obviously, this does only make sense if you are using wildcards:
- Up to this point, all this can be found here in the forum, in Henric's design blog referenced above, in the comments to his blog, in the tech doc or in some other threads. But I hope this document will add something useful to all this already available, though distributed material. Introducing the AFAIK not really well-known
XOR operator '^'
Using this operator, your compound search will return values that match either the first or the second search, but not both:
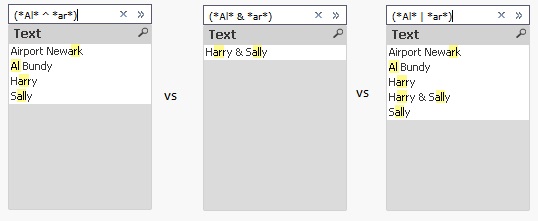
Another example for the XOR operator would be to find the complement of a search (for example search for *Sally*):
You could achieve this by selecting (Sally), then use the context menu to select excluded, but you can also use a single search: (* ^ *Sally*)
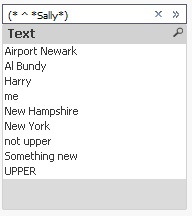
[Agreed, the syntax would be easier if there was an operator for NOT or complement, but I haven't found it so far. If you know it, please drop a comment below.]
All these operators can be used to not only combine two, but many searches: (me|Harry|Sally)
This would be a good point to end this document. But there is something more I haven't read about so far:
- Nesting compound searches
You can nest a compound search into another compound search. Why you may want to do this?
For example if you want to create a search like 'Return all values containing 'Harry', but exclude values where 'Sally' appears.
Since to my limited knowledge, there is no 'NOT' or complement unary search operator, you can emulate this search using the existing three search operators described above:

You can achieve similar without nesting, but take care of the order of your searches and operators:
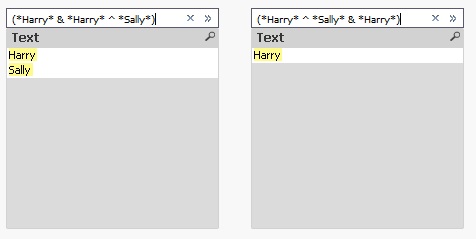
Some (or all?) of these results can of course be achieved using other search modes, I just wanted to focus on the compound search mode in this blog post. I hope all mysteries of the compound search have been revealed.
If you have any comments or questions, drop a comment below.
Have fun!
edits:
2016-02-02: Complement can be created easier, just using (* ^ *Sally*), added some more examples, reorganized some parts - Triggering a compound search
-
Month Freeze Document
Hi Folks, If any one interest to freeze all the data by month wise from sql and append it in the qvd to verify the changes per each month. It will hel... Show MoreHi Folks,
If any one interest to freeze all the data by month wise from sql and append it in the qvd to verify the changes per each month. It will help it.
Let vQVDPath = 'D:\';
Let vFreezeTableName = 'MONTH_FREEZE';
LET vNow = Now();
//GFIR
$(vFreezeTableName):
LOAD *,
'$(vNow)' AS MonthFreezeTime,
Floor(Today()) AS MonthFreezeDate,
Floor(MonthEnd(Today(), -1)) AS MonthFreezeDataUptoDate;
SQL Select * from tablename;
//Check the qvd is exists or not
LET vListQVDExists = not isnull(QVDCreateTime('$(vQVDPath)\$(vFreezeTableName).qvd'));
//If exists , concatenate with existing qvds
If($(vListQVDExists)) then
//Find the maximum date
MaxFreezeDate:
LOAD Max(MonthFreezeDate) AS MaxFreezeDateNum Resident $(vFreezeTableName);
//Get the maximum date_num
Let vMaxFreezeNum = Num(Peek('MaxFreezeDateNum',-1, 'MaxFreezeDate'));
//Drop the temporary table
DROP Table MaxFreezeDate;
Concatenate($(vFreezeTableName))
LOAD * From
$(vQVDPath)\$(vFreezeTableName).qvd(qvd)
Where MonthFreezeDate < $(vMaxFreezeNum);
ENDIF;
//Store freeze data into qvd
STORE $(vFreezeTableName) into $(vQVDPath)\$(vFreezeTableName).qvd(qvd);
//Drop the temporary table
DROP Table $(vFreezeTableName);
//Exit script
EXIT Script;
-
Connectivity to Oracle Database
Useful connectivity documentation from QlikView to Oracle Databases -
Generate columns dynamically without changes
Hello team.One of the user asked that newly added columns in source should automatically populate in Qlikview work book without any changes to the wor... Show MoreHello team.
One of the user asked that newly added columns in source should automatically populate in Qlikview work book without any changes to the work book.
I tried one POC for this case and implemented the same. Please find it in below attachment.
Note: This will not be feasible if we have more columns/rows in the table.
-
Set Analysis 1.pdf
The Most vital Set Analysis that we are using in creating our reports. Why we don't make it simple! This document will make it simple and straight for... Show MoreThe Most vital Set Analysis that we are using in creating our reports. Why we don't make it simple! This document will make it simple and straight forward to everyone. Good luck
-
What is a Mapping Load in Qlikview
What is a Mapping LoadMapping Load is definitely one of those essential tools for your QlikView and Qlik Sense scripting. Similar to a left join, but ... Show MoreWhat is a Mapping Load
Mapping Load is definitely one of those essential tools for your QlikView and Qlik Sense scripting. Similar to a left join, but different in distinct ways that allow you to do cool things in your QlikView scripts that would be difficult to do or would otherwise involve many steps.
Basically a mapping load allows you to “map in” a set of values to a recipient table based on a key field.
We will first look at the properties of these functions and examine the syntax. Then we will review 8 different applications of this to help you understand where these functions are a good fit.
The script below utilizes QlikView in this case, but we can apply these scripting techniques directly to Qlik Sense as well with the exception of the “from” statements which get changed to library connections.
Highlights of Mapping Load and ApplyMap
- Mapping loads come in two parts. First, a mapping table must be created. Then the map can be applied.
- Maps always consist of two fields. The first field is the key field that will be used to make the translation (the ID). The second field contains the values to be mapped.
- Once a map is created, it is held in memory until the script finishes and is then dropped. It can be reused as many times as needed in the script.
- When a map is applied, only the first encountered value from the mapped table is brought over.
- You can specify an optional value if no match is found for the mapped table.
Syntax for Mapping Load and ApplyMap
We first must create the map. Simply use a load prefix of “Mapping” to indicate this is a mapped table

- Note again that this is considered a temporary table in Qlik and will be dropped automatically at the end of the script.
- Also be aware that the first field is ALWAYS the key and the second field is ALWAYS the mapped value. The reason I emphasize this is because it is not important what the field names are called. Only the order matters.
- As long as the map table appears before we apply it, the map table can be anywhere in the script. I usually position it on the same script tab above the table I will be applying it to, but when I have maps that are applied several times, I might put that map load in script tab towards the front.
Then we can apply the map wherever needed. We will use the ApplyMap function where the first parameter is the map name (in single quotes), the second parameter is the key we use to translate the map from the current table and an optional third parameter will define a value when no match is found.

- A map can be applied multiple times within a script.
- We must use single quotes when referring to the map name.
- Note also that the key in the receiving table does not actually need to loaded as a separate field. In the example above, CustomerID has simply been commented out since we do not need to display this field in the app. We use it to translate the map but that is all we need it for.
Use Case 1 – Avoid Duplication in Fact Tables
Our central table is sacred. If we need to sum up sales or count rows or calculate any sort of metric, this is likely your fact table. It is important that maintain the integrity of this table and do not inadvertently add rows to it since that would mess up your calculations.
But there are times when we need to join data to this table. You might think that a left join is the way to do this. But what if the fields we use to join this table to our fact table actually have repeats? Notice in the charts below, when we do a left join, it will actually add records to the fact table. Now our totals are exaggerated for that customer.

If instead we do a mapping load, we ensure that only one of the ID records actually maps into the receiving table. In fact, the first record “Walmart” is mapped in and the second value “Wal-Mart” is discarded only because the load will encounter the “Walmart” value first in the current ordering of the map table.


Use Case 2 – Slowly Changing Dimensions – Only the Latest Value
This trait of mapping loads is also handy when we only want one value from the map but we want a specific value. Similar to the scenario above, if Walmart had changed their name at some point, we might want only the latest name. If we sort the table by the “Date Modified” field in descending order, we will only get the latest value. This can be helpful for mapping in slowly changing dimensions where we only want one of the values.


Use Case 3 – Easier to Manage than “Nested If’s”
Let’s consider a scenario where we have survey results on a numbered scale from 1-5. It might be handy to add the description for the numbers. We could create a “nested if” statement to handle this. This will work perfectly fine, but as this list gets larger, it might be difficult to maintain.

It might be better to map these values in, especially as the number of values in the list increases. Because the values can be provided in a table, this process becomes much easier to maintain as the number of distinct values grow.


Use Case 4 – Apply a Map and Do Math in the Same Step
Often times we must do a calculation within our script like “Quantity * Price as Extended_Amount”. But what about when the calculation we need must occur between fields that are not in the same table?
A mapping load can provide a quick answer here as well. The benefit here is that we can map the value in AND do the math in the same step. Without the mapping load function, we would be forced to join the second field to the first table and then reload the whole table using resident load.
In the example below, we need to come up with an extended cost of goods sold. But the standard cost of the item is retained in the item master, a separate table from our sales table. We will apply the cost to the sale record and do the calculation at the same time.


Use Case 5 – Reuse a Map Multiple Times
Often times, we will encounter an “attributes” table. This is a catch-all table that holds all textual descriptions for many ID fields. This single table might hold item descriptions, product families, reporting segments, etc. These tables have at least 3 columns: 1 for the value ID, 1 for the field ID and the text descriptor.
In this case, we can load this table as a map and then refer to it multiple times, wherever needed throughout our script, loading these text descriptions into appropriately named fields in our data model. Notice that we are concatenating the ValueID and the FieldID in the map and then using both fields in the map application as well. This ensures that if a ValueID has a repeat, we are not accidentally pulling text for a different field.
Below, we are applying the map once for our item description and then again for our category description.


Use Case 6 – Reference a Default Value When No Match Is Found
Often times, a business requirement will state that rather than a null value, we would like to see “No Description” for an item or “n/a” for example.
If you need to define a default value when there is no match, we can provide this value as a third parameter in the applymap function.
This example shows the simple use of a “no description” label when no match is found.


Use Case 7 – Reference a Backup Map When No Match Is Found
This is my favorite use-case for mapping loads. I have definitely had the situation where a client has said, “Well, first try find a match from this SQL table, but if there is no match, then try this spreadsheet, and if there is still no match, put n/a”.
Again, using the applymap third parameter, we can nest a backup applymap in the third parameter to meet this requirement. We could have an endless list of maps to satisfy the requirement, although I have never gone beyond three levels!
In this example, we will first go to the SQL table, then to a spreadsheet as a backup and then if there is still no match, we will add a manual description of “no description”.


Use Case 8 – Using a Map with Concatenated Keys
There might be times when our key needs to be a little more complex. Sometimes two or three fields are needed to key the mapped values to your receiving table, but as you recall, the mapping table can only have two fields.
In these cases, you can create one field that combines the keys. Just remember that you will have to create the same key when you apply the map. Learn Qlikview.


Source: Living Qlikview
-
Functions Cheatsheet.pdf
Hello Everyone,I have attached the document for the important Qlikview functions used in script as well as in UI.Please have a look and also feel free... Show MoreHello Everyone,
I have attached the document for the important Qlikview functions used in script as well as in UI.
Please have a look and also feel free to update the document or comment in the session for the functions which is missed.
-
Qlik Google Drive & Spreadsheet connector Steps
Hi Folks,This document provide steps to fetch the google spreadsheet information and use in qlikview by using "Qlik Google drive & Spreadsheet connect... Show MoreHi Folks,
This document provide steps to fetch the google spreadsheet information and use in qlikview by using "Qlik Google drive & Spreadsheet connector".
Hope this will help the beginner to use it.
-
Let's read Qlik
Greetings to all.I love Qlik, but lately I do not have enough time to keep track of everything that happens.I have to visit many resources for reading... Show MoreGreetings to all.
I love Qlik, but lately I do not have enough time to keep track of everything that happens.
I have to visit many resources for reading news, articles, tricks, videos.
I set myself the goal of being aware of everything, and spend no more than 5 minutes a day on it.
What can help us with this, of course RSS!
For a long time I tried to find a decent and at the same time a simple program for reading rss's ... and found - QuiteRSS (https://quiterss.org/).
Then I started to compile a list of interesting sites for me and add them to QuiteRSS.
At the moment, there is no particular hierarchy of feed, but I think that it will be needed.
Yes, I am sure that there are other sources of information, but I have not found them.
I propose to work on this issue together and lead an acute list.
Git Repo : https://gitlab.com/bintocher/QlikRSS
Can't attach new file, so link : https://gitlab.com/bintocher/QlikRSS/raw/master/qlik%20docs.opml
Updated 2019.01.22 - now total 53 rss feeds ; updated qlik community rss links
-
How to reload Qlikview application on every Monday?
How to reload Qlikview application on every Monday?///$tab MainSET ThousandSep=',';SET DecimalSep='.';SET MoneyThousandSep=',';SET MoneyDecimalSep='.'... Show MoreHow to reload Qlikview application on every Monday?
///$tab Main
SET ThousandSep=',';
SET DecimalSep='.';
SET MoneyThousandSep=',';
SET MoneyDecimalSep='.';
SET MoneyFormat='$#,##0.00;($#,##0.00)';
SET TimeFormat='h:mm:ss TT';
SET DateFormat='M/D/YYYY';
SET TimestampFormat='M/D/YYYY h:mm:ss[.fff] TT';
SET MonthNames='Jan;Feb;Mar;Apr;May;Jun;Jul;Aug;Sep;Oct;Nov;Dec';
SET DayNames='Mon;Tue;Wed;Thu;Fri;Sat;Sun';
SET vMonthStartDay=WeekDay(Monthstart(today()));
SET vWeekStartDay=WeekDay(Weekstart(today()));
///$tab Tab1
If $(vMonthStartDay)='Mon' or $(vWeekStartDay)='Mon' THEN
Tab1:
Load * inline [
A,S
1,2
];
elseif ;
///$tab Tab2
If $(vMonthStartDay)='Mon' or $(vWeekStartDay)='Mon' THEN
Tab2:
Load * inline [
A,S
1,2
];
elseif ;
///$tab Tab3
If $(vMonthStartDay)='Mon' or $(vWeekStartDay)='Mon' THEN
Tab3:
Load * inline [
A,S
1,2
];
elseif ;
///$tab Tab4
If $(vMonthStartDay)='Mon' or $(vWeekStartDay)='Mon' THEN
Tab4:
Load * inline [
A,S
1,2
];
elseif ;
-
Use Silent Legend with Cross Colors
When I create a dashboard to mantain a good layout and to offer a good user experience always I need to set the same color for the same dimension valu... Show MoreWhen I create a dashboard to mantain a good layout and to offer a good user experience always I need to set the same color for the same dimension value in each chart.
Unfortunally there isnt' a easy way to do this, and often a solution is to create some additional fields (R,G,B) for each dimension.
I don't like to have dozens of fields in my model with the problem to naming them.
To turn around this problem, I writed a single expression in a variable that doing all for me and now I use it always.
Let's see if you like this method too.
The idea is to use the functions Pick(Match(...)) to realize the magic.
I use QlikView Test Script and Qlikview Components library to realize an example. Test Script create the dimensions Dim1, Dim2, Dim3 and the expressions.
For Dim1 the values are A, B, C
For Dim2 the values are a, b, c, d, e, f
For Dim3 the values are X, Y, Z
For each values in dimensions need to set a variable with the associate color, to do easy this I use ColorTheme.xlsm file and use Qvc.ColorTheme to read it.
Now the best point... our function Pick(Match(...)), that I called App.Color.GetForField and set the value in Settings.xlsx.
Here the value:
=Pick(Match(Only($(=$1)), ' & Chr(39) & Concat({1} DISTINCT $(=$1), Chr(39) & Chr(44) & Chr(39)) & Chr(39) & '), ' & PurgeChar( Replace( 'App.Color.v.Dimension.$(=$1).' & Concat({1} DISTINCT $(=$1), chr(10) & ',App.Color.v.Dimension.$(=$1).') , ' ', '_'), '[]') & ')'
To use it in a chart write $(=$(App.Color.GetForField('[Dim1]'))) in the expression's backgroud property
The values in specificated dimension get automatically choosed color.
I hope you like this.
Regards
Luca Jonathan Panetta
-
Ascii Table for reference
Dear All,Attached is the Ascii table for ASCII code and the reference for the Ascii code and Ascii Symbol.Regards,Anand


