Unlock a world of possibilities! Login now and discover the exclusive benefits awaiting you.
- Qlik Community
- :
- All Forums
- :
- QlikView App Dev
- :
- Re: Display data point values on line chart
- Subscribe to RSS Feed
- Mark Topic as New
- Mark Topic as Read
- Float this Topic for Current User
- Bookmark
- Subscribe
- Mute
- Printer Friendly Page
- Mark as New
- Bookmark
- Subscribe
- Mute
- Subscribe to RSS Feed
- Permalink
- Report Inappropriate Content
Display data point values on line chart
Hi there,
I have a line chart with an x-axis time series (which is updated each day with the latest information). The user can select the point in time which they want to view the line chart or default latest update day (today). Because of the number of value points on the line chart it is difficult to see the data values.
Is it possible to restrict the data values to only the selected (latest) date? This means there is only one value visible on the line chart (the last one).
Have tried using the 'Show Value' field but have not been successful. The 'TODAY' function works only if the default value is selected (today). Once the user selects a date prior to today the field does not show.
Thanks
- Tags:
- new_to_qlikview
- « Previous Replies
- Next Replies »
- Mark as New
- Bookmark
- Subscribe
- Mute
- Subscribe to RSS Feed
- Permalink
- Report Inappropriate Content
Add a second expression sourced from the first, but that only establishes itself for the dates you want. For example:
TotalSales = sum(Sales)
DisplayTotalSales = if(Date=max(total Date),TotalSales)
Only display data values on the second expression. Maybe I'm missing an easier way, though, as I don't see the "Show Value" on a line chart. Maybe I'm just missing something, or maybe it's a v10 feature (I'm on v9). You might be able to refer to max(total Date) in that field, or max(Date).
- Mark as New
- Bookmark
- Subscribe
- Mute
- Subscribe to RSS Feed
- Permalink
- Report Inappropriate Content
Hi John,
Thanks for your response.
To make it simpler to understand what I am trying to achieve here is a screenshot. The
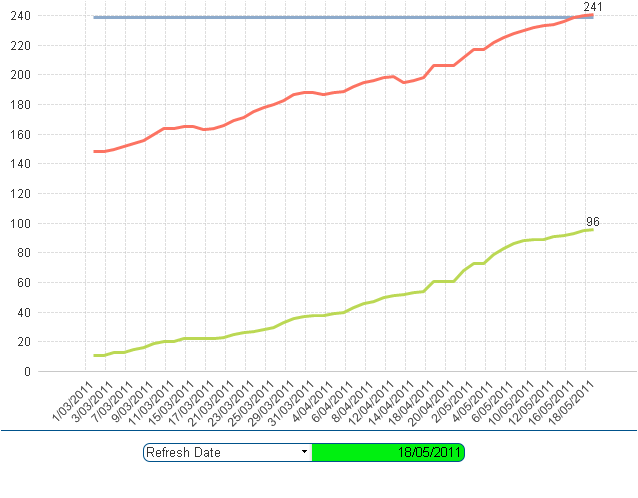
If the user selects a previous date the data is shown only up to that 'selected' date. I want the data value for the selected date to be displayed on the end of the line graph. The screenshot above uses the 'TODAY' (REFRESH_DATE=TODAY('DD/MM/YYYY') function. Obviously this does not work when a historical date is selected.
Cheers
Karl
- Mark as New
- Bookmark
- Subscribe
- Mute
- Subscribe to RSS Feed
- Permalink
- Report Inappropriate Content
This is a very important question. any answer?
- Mark as New
- Bookmark
- Subscribe
- Mute
- Subscribe to RSS Feed
- Permalink
- Report Inappropriate Content
aryehgros wrote:
This is a very important question. any answer?
They're ALL very important questions. I bet there aren't very many people on this forum posting questions out of idle curiosity.
I answered this one. But it appears that either I misunderstood the question, or I did understand it, and Karl and you did not understand my answer. Or maybe my answer is wrong. I can think of cases where it wouldn't work, but nobody has said that either. As far as I can tell, nobody tried my answer.
What I suggested above is looking for the maximum date displayed on the chart, and putting a value above that data point. Karl said "the data is shown only up to that 'selected' date". So the maximum date displayed on the chart should be the 'selected' date, and therefore only that data point should have a data value above it. So what I suggested appears to me to be a solution to the problem.
Karl doesn't appear to have tried that solution. He appears to have tried using today(). I didn't suggest using today(), because "Obviously this does not work when a historical date is selected."
Now, in this specific case, it now appears that field "Refresh Date" contains the date for the data we want to display. So here, you could simplify the solution I gave to this:
DisplaySomething = if(Date="Refresh Date",Something) // display values on this expression only
But I have no idea if I'm even answering the right question.
- Mark as New
- Bookmark
- Subscribe
- Mute
- Subscribe to RSS Feed
- Permalink
- Report Inappropriate Content
Hi Karl,
If possible, could you pls send us the sample.qvw file.
Thanks
vinod
- Mark as New
- Bookmark
- Subscribe
- Mute
- Subscribe to RSS Feed
- Permalink
- Report Inappropriate Content
Hi All !
As per the John's Instructions i hv created an application .
John u r unbeatable!!!!
- Mark as New
- Bookmark
- Subscribe
- Mute
- Subscribe to RSS Feed
- Permalink
- Report Inappropriate Content
may be this ( for credit of Erika and John)
please ssee the attched file
- Mark as New
- Bookmark
- Subscribe
- Mute
- Subscribe to RSS Feed
- Permalink
- Report Inappropriate Content
John/Erica/Sunil,
thanks for your reply.
v10
I just discovered another solution. I used the reference-line. within the reference-lines dialog, you need to populate the expression & label. you should also set the "show label in chart" flag
For a combo-box it can be found on the Presentation tab. my needs are slightly different. I have a warehouse that i'm charting historical utilization vs capacity. the capacity (size of the warehouse) doesn't usually change, so on the capacity line it should display the value only once. The utilization number should display for each month, since the utilization amount constantly changes.
problems with my solution:
1) you can't dynically dictate the location of the text. it can be be hard coded with spaces.
Problems with your solution
1) The legend displays "Value" twice
- Mark as New
- Bookmark
- Subscribe
- Mute
- Subscribe to RSS Feed
- Permalink
- Report Inappropriate Content
The reason the legend is displaying "Value" twice is that I stated one of the instructions VERY poorly. I'd said "Only display data values on the second expression." I really meant two things by this - on the first expression, do not display data values, and on the second expression, ONLY display data values. In other words, remove the checkmark next to "Line" for the second expression. I definitely should have written that differently.
The example is also using a variable, which I wouldn't bother with, and the example fails when you don't select any date. You can fix that by changing the expression to what I said to use, which in the context of this example would be this:
if(Date=max(total Date),Value)
Heh, nope. One minor error. It's displaying the nulls as '-'. I didn't expect that. So change it to a space, I guess:
if(Date=max(total Date),Value,' ')
That works. Thanks for building the example, Erika.
Edit: Oops, I didn't remove the variable like I suggested. I've updated the attachment to do so. Here's the new expression for Value:
sum({<Date={"<=$(=max(Date))"}>} Value)
- « Previous Replies
- Next Replies »