Unlock a world of possibilities! Login now and discover the exclusive benefits awaiting you.
- Qlik Community
- :
- Forums
- :
- Analytics
- :
- New to Qlik Analytics
- :
- Rank in the Script - Sankey Chart
- Subscribe to RSS Feed
- Mark Topic as New
- Mark Topic as Read
- Float this Topic for Current User
- Bookmark
- Subscribe
- Mute
- Printer Friendly Page
- Mark as New
- Bookmark
- Subscribe
- Mute
- Subscribe to RSS Feed
- Permalink
- Report Inappropriate Content
Rank in the Script - Sankey Chart
Hello,
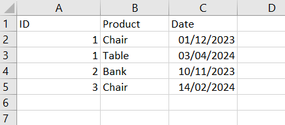
I have an excel file like this :
I want to know if a client bought a chair, what will he buy next?
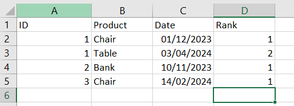
So I loaded this table, and then created a dimension : =Aggr(rank([Date]),ID, [Date])
I have now the table below :
But when I try to do a sankey chart with :
First dimension : Product1 =if(Aggr(rank([Date]),ID, [Date])=1,Product)
Second dimension : Product2 =if(Aggr(rank([Date]),ID, [Date])=2,Product)
My problem is : The Product1 and the Product2 are not linked
I think that if I load this dimension in the script : Aggr(rank([Date]),ID, [Date])
it will be linked, but the function doesn't work in the script 😞
- Mark as New
- Bookmark
- Subscribe
- Mute
- Subscribe to RSS Feed
- Permalink
- Report Inappropriate Content
I did that in the script, it works but it takes sooo much time to load when I try to load a big table
TABLE1:
LOAD
ID,
Product,
Date
FROM [xx.csv]
(txt, utf8, embedded labels, delimiter is ';', msq)
;
TABLE1_Rank:
LOAD
ID,
Product,
Date,
Autonumber("Date",ID) AS RANK
RESIDENT TABLE1
Order By "Date" ASC
;
RANK_1:
Load
ID,
Product AS Product_1
RESIDENT TABLE1_Rank
WHERE RANK=1
;
JOIN
RANK_2:
Load
ID,
Product AS Product_2
RESIDENT TABLE1_Rank
WHERE RANK=2
;
DROP TABLE TABLE1;
DROP TABLE TABLE1_Rank;

