Unlock a world of possibilities! Login now and discover the exclusive benefits awaiting you.
- Qlik Community
- :
- All Forums
- :
- QlikView App Dev
- :
- Re: Creating Target value in a pivot chart
- Subscribe to RSS Feed
- Mark Topic as New
- Mark Topic as Read
- Float this Topic for Current User
- Bookmark
- Subscribe
- Mute
- Printer Friendly Page
- Mark as New
- Bookmark
- Subscribe
- Mute
- Subscribe to RSS Feed
- Permalink
- Report Inappropriate Content
Creating Target value in a pivot chart
Hello All,
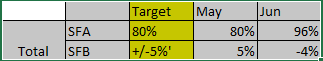
i am trying to insert a target field (like SFA = 70% and SFB is 10%) in the below table of the qlik view. and my current expression is as following:
NUM(IF(SUM({<CALCULATION_TYPE = {'SFA'}>}[FC: VALUE ERROR]) / SUM({<CALCULATION_TYPE = {'SFA'}>}[ACTUAL VALUE]) > 1, 0,
IF(SUM({<CALCULATION_TYPE = {'SFA'}>}[FC: VALUE: (Vol x NSV Rate)]) * SUM({<CALCULATION_TYPE = {'SFA'}>}[ACTUAL VALUE]) <= 0, 0,
1-(SUM({<CALCULATION_TYPE = {'SFA'}>}[FC: VALUE ERROR]) / SUM({<CALCULATION_TYPE = {'SFA'}>}[ACTUAL VALUE])))), '##.00%')
Could you please advise how to do it. I have created an inline table as follows but still not getting the out put.
- Mark as New
- Bookmark
- Subscribe
- Mute
- Subscribe to RSS Feed
- Permalink
- Report Inappropriate Content
You can refer Pareto Analysis:
Num(Sum({<[Customer ID] = {"=Rank(Sum(Revenue)) < (Count(TOTAL DISTINCT [Customer ID])*0.20) + 1"}>}Revenue)/Sum(Revenue), '##.0%').
- Mark as New
- Bookmark
- Subscribe
- Mute
- Subscribe to RSS Feed
- Permalink
- Report Inappropriate Content
- Mark as New
- Bookmark
- Subscribe
- Mute
- Subscribe to RSS Feed
- Permalink
- Report Inappropriate Content
Hi ,
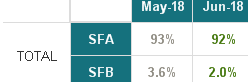
Target value i have it as inline table in the script.
The out put should be like this