Unlock a world of possibilities! Login now and discover the exclusive benefits awaiting you.
- Qlik Community
- :
- All Forums
- :
- QlikView App Dev
- :
- Gauge and Bar Chart don't Equal Each other
- Subscribe to RSS Feed
- Mark Topic as New
- Mark Topic as Read
- Float this Topic for Current User
- Bookmark
- Subscribe
- Mute
- Printer Friendly Page
- Mark as New
- Bookmark
- Subscribe
- Mute
- Subscribe to RSS Feed
- Permalink
- Report Inappropriate Content
Gauge and Bar Chart don't Equal Each other
I have a Gauge chart and a bar chart on the same report and it shows the same information the gauge chart just shows the percent for the whole period and the bar chart shows the percent for each period. But the gauge chart does not show the same number when there is multiple days or quarters shown in the bar chart. It only shows the same value when there is only a single day selected does anyone have any idea why this might be happening.
the code being used is :
count({<Source={'Order'},[Order Document Type_AUART] -= {$(vExcludedQT)} , [RejectionReason_ABGRU]={' '}, [Pur. ord. type_BSARK] -= {'XML', 'EDI', 'WEB'}>}if(match([Order Ent. Time],'1','0'),[Order Ent. Time]))/count({<Source={'Order'}, [Order Document Type_AUART] -= {$(vExcludedQT)} , [RejectionReason_ABGRU]={' '}, [Pur. ord. type_BSARK] -= {'XML', 'EDI', 'WEB'} >}[Order Item_POSNR])
- Mark as New
- Bookmark
- Subscribe
- Mute
- Subscribe to RSS Feed
- Permalink
- Report Inappropriate Content
Not sure what number in the bar chart you want the gauge chart to match as you have multiple numbers in the bar chart.
The reason why you can't find 93.34% in the bar chart is that you have an extra dimension (Quarter in the picture) so you get the calculation per Quarter, while the gauge chart shows it as a single combined number for all quarters.
Since the dimension in the bar chart is a drill down I guess you get multiple bars until you drill down to a single day.
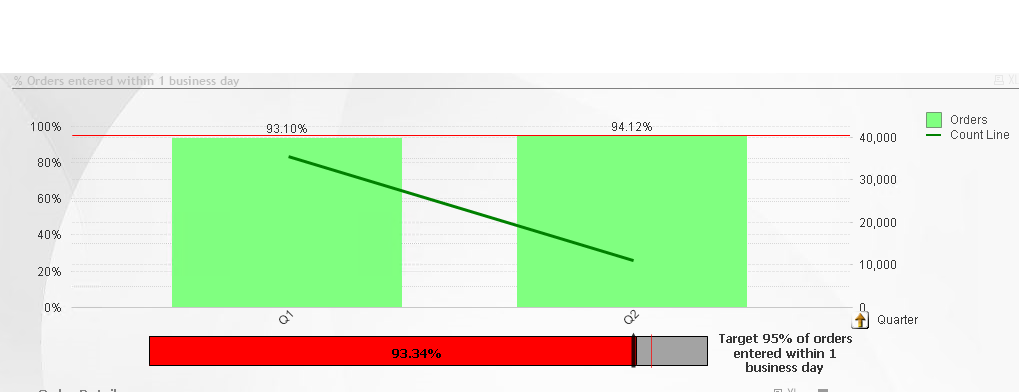
Looking at the graph and gauge I can calculate the 93.34% shown in the gauge chart.
Q1: 93.10% and around 35000 lines
Q2: 94.12% and around 11000 lines
So 93.10% * 35 / (35+11) + 94,12 * 11 / (35+11) = 93.34