Unlock a world of possibilities! Login now and discover the exclusive benefits awaiting you.
- Qlik Community
- :
- All Forums
- :
- QlikView App Dev
- :
- Mapping Load
- Subscribe to RSS Feed
- Mark Topic as New
- Mark Topic as Read
- Float this Topic for Current User
- Bookmark
- Subscribe
- Mute
- Printer Friendly Page
- Mark as New
- Bookmark
- Subscribe
- Mute
- Subscribe to RSS Feed
- Permalink
- Report Inappropriate Content
Mapping Load
Hey community,
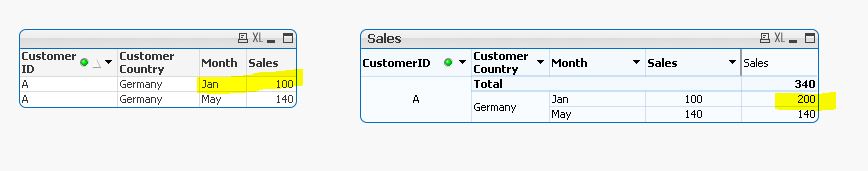
i have this script and i write "A, Jan, 100" twice i try to understand if i can see both of the line together at table view.
the only way i can see the total of them is at Pivot table.
but i want to see germany jan twice
Thx
CustomerTable:
Mapping Load * Inline
[
CustomerID, Country
A, Germany
B, France
C, Italy
D, Poland
E, Spain
Z, UK
H, ISRAEL
A, Germany ];
Sales:
Load *,
ApplyMap('CustomerTable', CustomerID, 'Unkown Country ') As CustomerCountry
Inline
[
CustomerID, Month, Sales
A, Jan, 100
A, Jan, 100
B, Jan, 200
C, Jan, 300
D, Feb, 150
E, Mar, 200
F, Apr, 100
A, May, 140
D, May, 80
E, May, 100
F, Jun, 150
Z, Apr, 100
];
Accepted Solutions
- Mark as New
- Bookmark
- Subscribe
- Mute
- Subscribe to RSS Feed
- Permalink
- Report Inappropriate Content
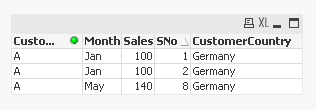
May be add a new field using RowNo() which makes both instances of Jan unique:
CustomerTable:
Mapping Load * Inline
[
CustomerID, Country
A, Germany
B, France
C, Italy
D, Poland
E, Spain
Z, UK
H, ISRAEL
A, Germany ];
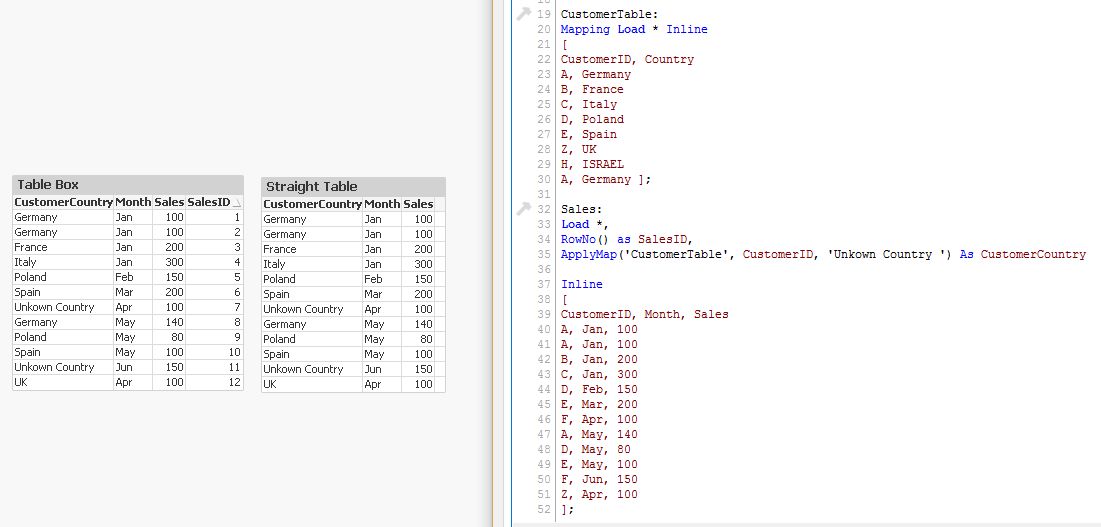
Sales:
Load *,
RowNo() as SNo,
ApplyMap('CustomerTable', CustomerID, 'Unkown Country ') As CustomerCountry
Inline
[
CustomerID, Month, Sales
A, Jan, 100
A, Jan, 100
B, Jan, 200
C, Jan, 300
D, Feb, 150
E, Mar, 200
F, Apr, 100
A, May, 140
D, May, 80
E, May, 100
F, Jun, 150
Z, Apr, 100
];
- Mark as New
- Bookmark
- Subscribe
- Mute
- Subscribe to RSS Feed
- Permalink
- Report Inappropriate Content
May be add a new field using RowNo() which makes both instances of Jan unique:
CustomerTable:
Mapping Load * Inline
[
CustomerID, Country
A, Germany
B, France
C, Italy
D, Poland
E, Spain
Z, UK
H, ISRAEL
A, Germany ];
Sales:
Load *,
RowNo() as SNo,
ApplyMap('CustomerTable', CustomerID, 'Unkown Country ') As CustomerCountry
Inline
[
CustomerID, Month, Sales
A, Jan, 100
A, Jan, 100
B, Jan, 200
C, Jan, 300
D, Feb, 150
E, Mar, 200
F, Apr, 100
A, May, 140
D, May, 80
E, May, 100
F, Jun, 150
Z, Apr, 100
];
- Mark as New
- Bookmark
- Subscribe
- Mute
- Subscribe to RSS Feed
- Permalink
- Report Inappropriate Content
Have you tried a Straight Table, as opposed to a Pivot Table ?
- Mark as New
- Bookmark
- Subscribe
- Mute
- Subscribe to RSS Feed
- Permalink
- Report Inappropriate Content
Hi David,
the best way will be to use Sunny's idea and put it into a straight table in UI:
Hope this helps
Burkhard
- Mark as New
- Bookmark
- Subscribe
- Mute
- Subscribe to RSS Feed
- Permalink
- Report Inappropriate Content
Hey @bill.markham yes i did its show me the result on the pivot table also i try to see the result on the regular table.