Unlock a world of possibilities! Login now and discover the exclusive benefits awaiting you.
- Qlik Community
- :
- All Forums
- :
- QlikView App Dev
- :
- Using an Expression as a Set Analysis Value
- Subscribe to RSS Feed
- Mark Topic as New
- Mark Topic as Read
- Float this Topic for Current User
- Bookmark
- Subscribe
- Mute
- Printer Friendly Page
- Mark as New
- Bookmark
- Subscribe
- Mute
- Subscribe to RSS Feed
- Permalink
- Report Inappropriate Content
Using an Expression as a Set Analysis Value
I am displaying a line graph of multiple application names and their corresponding "uptime" percentage per month / year.
The dimensions are Year, month in a drill down group and app name.
Year, month on the X axis and App name on Y axis.
I need for the graph to show only uptime based on the year 2013 and not the current selections.
Below is what I have and I would appreciate any help getting this to work.
= sum({<Year = {2013}>}(([Minutes MTD] - sum([Total_Impact_Minutes])) / ([Minutes MTD])))
- Mark as New
- Bookmark
- Subscribe
- Mute
- Subscribe to RSS Feed
- Permalink
- Report Inappropriate Content
Can you provide a sample data?
- Mark as New
- Bookmark
- Subscribe
- Mute
- Subscribe to RSS Feed
- Permalink
- Report Inappropriate Content
Hi,
pls specify the formula that u want to implement the set analysis.
u don't need to implement the set analysis in only one aggregate function as u have done now.
what u have done now is
(a {set analysis} -b/c).
I would prefer to use it as
((a{Set analysis})-(b{set analysis}))/(c{set analysis})
sum({<year={$(=max(year))}>}sales) this would return the max year among the selection.
where sum({1<year={$(=max(year))}>}sales) this would return the max year irrespective of selections.
hope this helps.
-Sundar
- Mark as New
- Bookmark
- Subscribe
- Mute
- Subscribe to RSS Feed
- Permalink
- Report Inappropriate Content
//first formula
= sum({<Year = {2013}>}(([Minutes MTD]
// is this the second formula?
- sum([Total_Impact_Minutes])) / ([Minutes MTD])))
Are you getting an error at present?
- Mark as New
- Bookmark
- Subscribe
- Mute
- Subscribe to RSS Feed
- Permalink
- Report Inappropriate Content
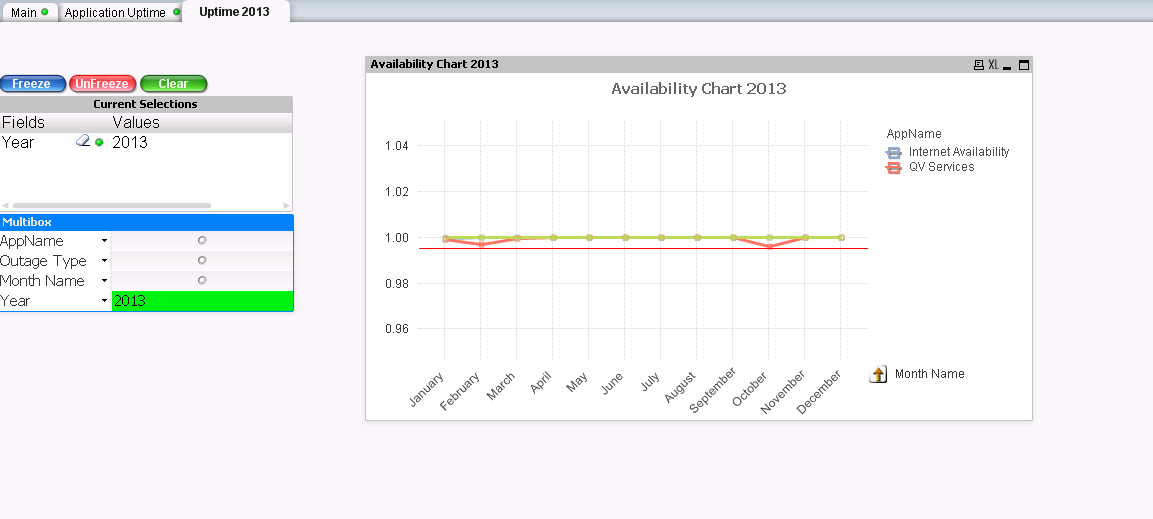
Here is the graph that I want to display that is independent to the current selections. The expression that I am using shows the uptime for the application. The current expression is "=(([Minutes MTD] - sum([Total_Impact_Minutes])) / ([Minutes MTD]))"
[Minutes MTD] is the number of minutes per month
sum[Total_Impact_Minutes] is the sum of the impact minutes for the application
As an example for "Internet Availability in July 2013" there was a total of an 2 minute outage. In order to achieve the uptime % for Internet Availability in July 2013 I have to calculate the following.
=(([Minutes MTD] - sum([Total_Impact_Minutes])) / ([Minutes MTD]))"
=(([44640] - sum([2])) / ([44640])) = roughly 0.999955
Is set analysis the best way to achieve this to show only the year 2013 and not based on current selections?
- Mark as New
- Bookmark
- Subscribe
- Mute
- Subscribe to RSS Feed
- Permalink
- Report Inappropriate Content
The tab that contains what I need help on is called "uptime 2013"
- Mark as New
- Bookmark
- Subscribe
- Mute
- Subscribe to RSS Feed
- Permalink
- Report Inappropriate Content
I have attached sample .qvw below along with a detailed description.
- Mark as New
- Bookmark
- Subscribe
- Mute
- Subscribe to RSS Feed
- Permalink
- Report Inappropriate Content
RJ,
Thank you for the help! The suggestion did not work. I have attached sample .qvw below.
- Mark as New
- Bookmark
- Subscribe
- Mute
- Subscribe to RSS Feed
- Permalink
- Report Inappropriate Content
It was a question
I'm unsure what you are trying to do