Unlock a world of possibilities! Login now and discover the exclusive benefits awaiting you.
- Qlik Community
- :
- All Forums
- :
- QlikView App Dev
- :
- Year over year comparison when multiple years are ...
- Subscribe to RSS Feed
- Mark Topic as New
- Mark Topic as Read
- Float this Topic for Current User
- Bookmark
- Subscribe
- Mute
- Printer Friendly Page
- Mark as New
- Bookmark
- Subscribe
- Mute
- Subscribe to RSS Feed
- Permalink
- Report Inappropriate Content
Year over year comparison when multiple years are calculated
Hello Qlikusers,
Need help in calculating the YOY comparison for multiple years :
This is one for our KPIwhich need to be calculated in a Text box.
When user selects two years its straight forward, if more than 2 are selected we need to follow below calculations.
Using qlivkiew 12 version
Is there a way that we can do in minimal steps
Scenario 1:
if three years of selected data (2015 + 2016 + 2017)
= Average of the % Change between 2015 and 2016 & 2016 and 2017
If % change from 2015 to 2016 = 2%
if % change from 2016 to 2017 = 4%
Then Average % Change = [2 + 4] / 2 = 3%
Scenario 2:
if Four years of selected data (2015 + 2016 + 2017+2018)
= Average of the % Change between 2015 and 2016 & 2016 and 2017
If % change from 2015 to 2016 = 2%
if % change from 2016 to 2017 = 4%
if % change from 2017 to 2018 = 6%
Then Average % Change = [2 + 4+6] / 3= 4%
what if user selects 8 years?
Example:
Beginning value = $100,000
End of year one value = $120,000
End of year two value = $135,000
End of year three value = $160,000
End of year four value = $200,000
The formula to determine the percentage growth for the year is:
Percentage growth = (Ending value / Beginning value) -1
Thus, the growth rates for each of the years is as follows:
Year one growth = $120,000 / $100,000 - 1 = 20%
Year two growth = $135,000 / $120,000 - 1 = 12.5%
Year three growth = $160,000 / $135,000 - 1 = 18.5%
Year four growth = $200,000 / $160,000 - 1 = 25%
To find the AAGR, and analyst simply needs to find the average of these growth rates:
AAGR = (20% + 12.5% + 18.5% + 25%) / 4 = 19%
Read more: Average Annual Growth Rate (AAGR) https://www.investopedia.com/terms/a/aagr.asp#ixzz5EYefHcbg
Follow us: Investopedia on Facebook
Helpful answers are appreciated.
Thanks
Sree
- Tags:
- qlikview_scripting
Accepted Solutions
- Mark as New
- Bookmark
- Subscribe
- Mute
- Subscribe to RSS Feed
- Permalink
- Report Inappropriate Content
- Mark as New
- Bookmark
- Subscribe
- Mute
- Subscribe to RSS Feed
- Permalink
- Report Inappropriate Content
May be this
Avg(Aggr(Sum(Measure)/Above(Sum(Measure)), Year))
or
Avg(Aggr(Sum(Measure)/Above(Sum(Measure)), (Year, (NUMERIC))))
- Mark as New
- Bookmark
- Subscribe
- Mute
- Subscribe to RSS Feed
- Permalink
- Report Inappropriate Content
Thanks for the reply sunny,
We need to calculate in a Text Box.
Let me know if you need anything
Thanks
Sree..
- Mark as New
- Bookmark
- Subscribe
- Mute
- Subscribe to RSS Feed
- Permalink
- Report Inappropriate Content
Sree - this should work in the text box object... is it not working?
- Mark as New
- Bookmark
- Subscribe
- Mute
- Subscribe to RSS Feed
- Permalink
- Report Inappropriate Content
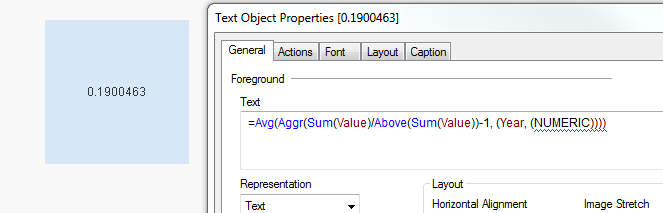
My bad, I missed the -1
Avg(Aggr(Sum(Measure)/Above(Sum(Measure))-1, Year))
or
Avg(Aggr(Sum(Measure)/Above(Sum(Measure))-1, (Year, (NUMERIC))))
- Mark as New
- Bookmark
- Subscribe
- Mute
- Subscribe to RSS Feed
- Permalink
- Report Inappropriate Content
Sample attached with the image
- Mark as New
- Bookmark
- Subscribe
- Mute
- Subscribe to RSS Feed
- Permalink
- Report Inappropriate Content
Thanks Sunny,
Its working in the text box, it works but if we select only year from the list box then it fails, as above function is not able to get the values from previous year
- Mark as New
- Bookmark
- Subscribe
- Mute
- Subscribe to RSS Feed
- Permalink
- Report Inappropriate Content
Ignore selection in Year field for your Above() expression
Avg(Aggr(Sum(Measure)/Above(Sum({<Year>}Measure))-1, (Year, (NUMERIC))))